How to use Citrix NetScaler Insight Center to report on web, HDX, and Access Gateway (AGEE) traffic

I love Netscalers, they're my favorite Citrix product. But one of the features I have always felt they are a bit lacking on was reporting. You might get requests from management asking how many users are hitting the Access Gateway (AGEE), when are they logging in, what is the session duration, etc. There is some pretty good data in the Netscaler dashboard but it is real time. Not historical. In the past, I have personally used the following for historical reporting on AGEE and any of my load balanced vservers:
-
3rd party tool like Solarwinds utilizing via SNMP on the Netscaler
-
Enabling web logging on the Netscaler and extracting the data I need using LogParser
-
Using Citrix EdgeSight to report on clients (WI/StoreFront vs. PNAagent traffic) but hard to segment multiple traffic sources (especially when a XenDesktop session is launched and apps are launched through Citrix Receiver Enterprise/PNAgent via Start menu which will always appear as local traffic)
-
Using Netscaler Reporting Tool And then there are some other 3rd party tools like Splunk for Netscaler which I haven't used yet so can't comment on. Regardless, the methods I have used in the past are nice but are very time consuming to get the metrics I need. I always wished Citrix would address this and when Citrix Command Center was released a few years ago, I thought a full blown management utility would include reporting but unfortunately it didn't.
This all changes with Netscaler Insight (or Netscaler Insight Center as it is being called now). It's a virtual appliance running on a XenServer that uses AppFlow on the Netscaler to pull metrics down and display it in a self contained web portal. And it's supposed to even plugin with XenDesktop 7 Director in the future. If you have any Netscaler appliances in your environment, you NEED to download Insight Center right now and at least start getting familiar with it. Really, I could see it quickly become a necessary component for a successful Netscaler deployment. It does way more than just reporting, think of it as a single pane of glass into your Netscaler environment. As we all know, in IT visibility is key. From an engineer who needs metrics for working on an appliance to a CIO who needs to justify the cost of appliances and licenses, you need some sort of easy and reliable visibility of what's actually going on. You can read all about the features here:
http://www.citrix.com/products/netscaler-application-delivery-controller/features/visibility.html
(Make sure to click on the little video box on the right side of that page. It does a pretty good job of giving a high level overview of Insight Center) I started writing this article several months ago after playing with Netscaler Insight 1.0. There was barely any info about the product at the time. I started taking screenshots but decided not to publish this article because the Netscaler Insight 2.0 product was coming soon and was going to be a more polished product. Honestly, the 1.0 product was lacking many features. My biggest sticking point with it was that you could not view Access Gateway traffic. The eDoc for it clearly said it could but there was no way to do it. I actually had to call Citrix and escalate to the engineering team to find out this was going to be a feature of 2.0. So I decided to wait it out till the 2.0 release before publishing this article.
NetScaler Insight Center 2.0 Build 112.13 was released on May 21st and you can download the standalone virtual appliance image or the 90 MB upgrade pack from 1.0 to 2.0 if you're an early adopter like me from here (you'll need to login with your MyCitrix ID):
https://www.citrix.com/downloads/netscaler-adc/components/netscaler-insight-center-20
Again, I started writing this article using NetScaler Insight 1.0 Build 72.53 and even as is with the missing features, it's been pretty nice for a 1.0 product. It is a 840 MB .xva virtual appliance based on FreeBSD just like a Netscaler VPX. I'm going to use my prior screenshots of the product to go over the setup portion and then dive right into the upgrade to Insight Center if you're an early adopter.
SETTING UP NETSCALER INSIGHT 1.0
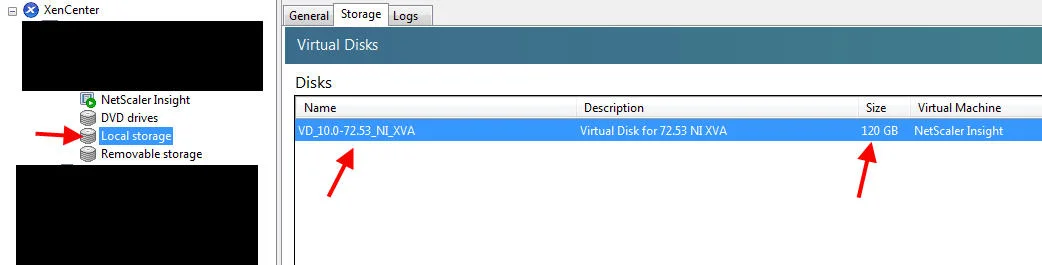
- I did this with the 1.0 virtual appliance but setting up 2.0 should be no different. Once you get the .xva imported into XenServer, it's going to ask you for the IP, subnet, and gateway when you click the Console tab just like setting up a Netscaler VPX. Just get all this entered and save. One thing to note, once it is is imported it takes up 120 GB so make sure you have plenty of storage before attempting to import the virtual appliance.
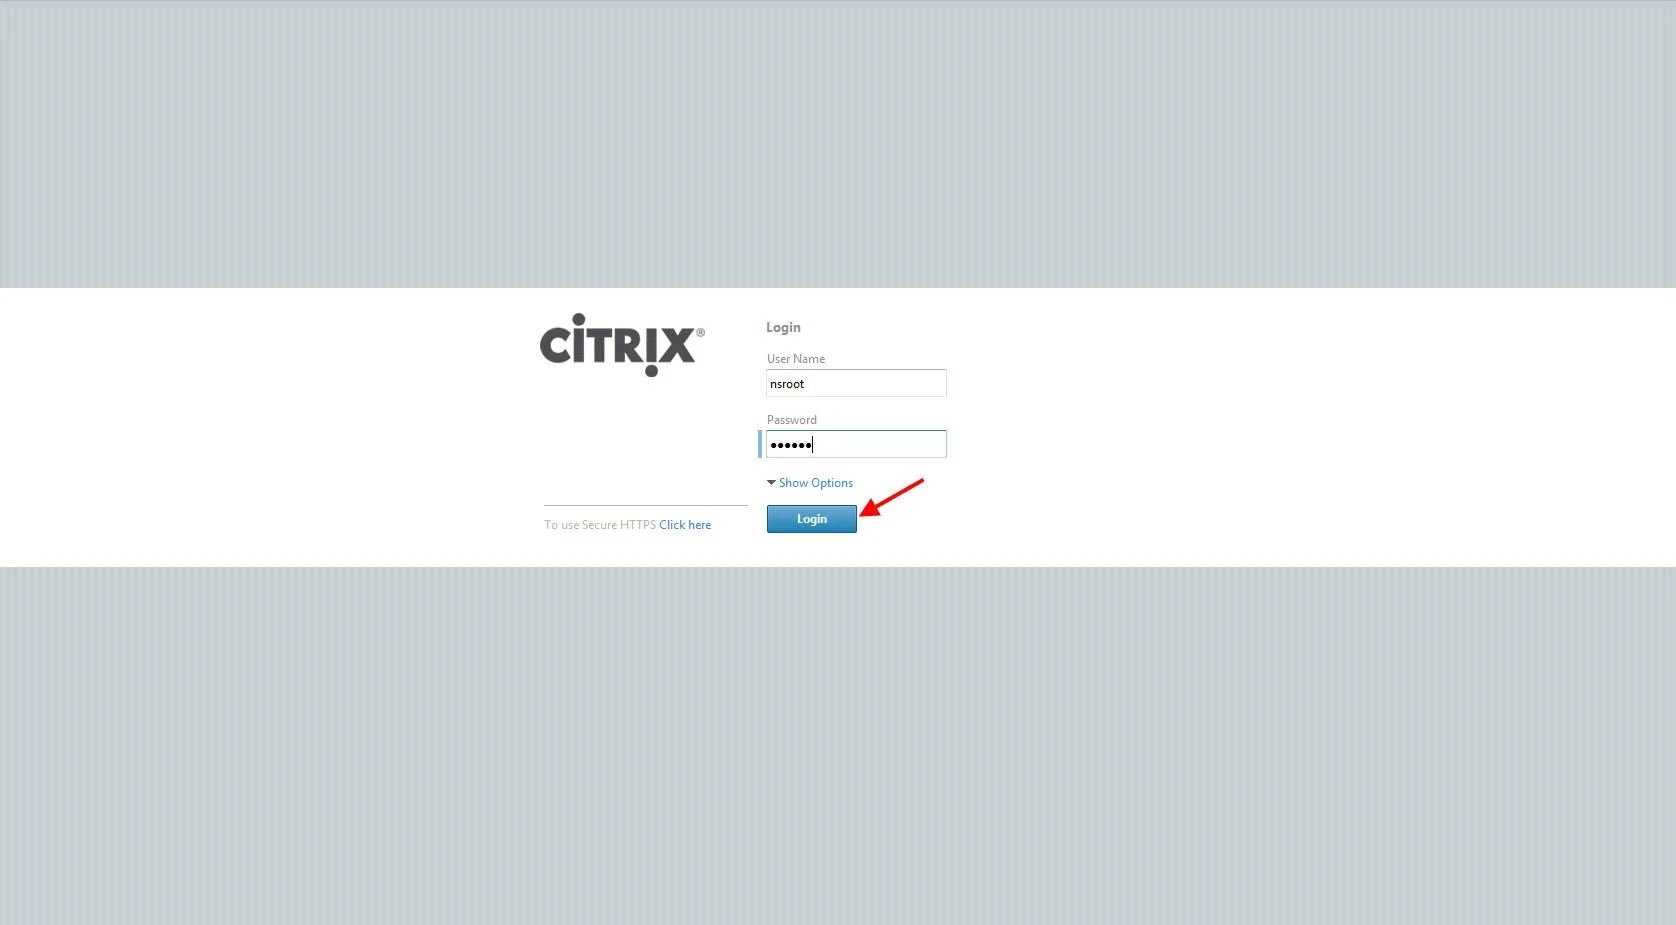
- Now open up a web browser and navigate to the IP you entered for the appliance. You will see the Insight login page. The default user ID and password is just nsroot/nsroot.
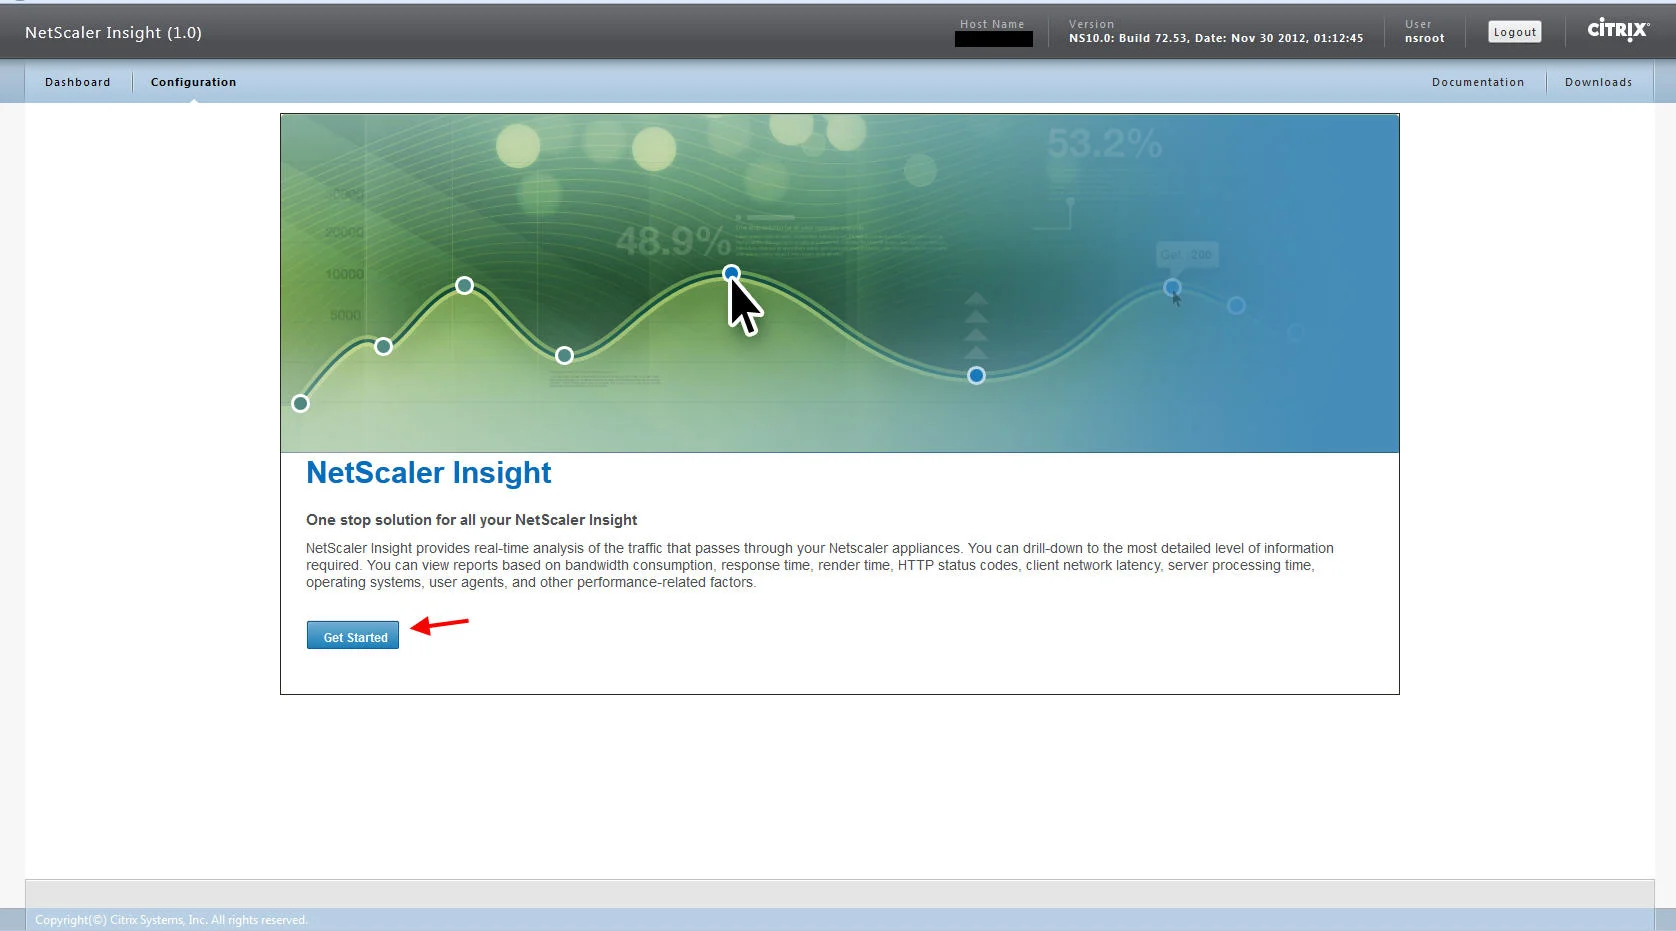
- Once you login, you will get this Getting Started page.
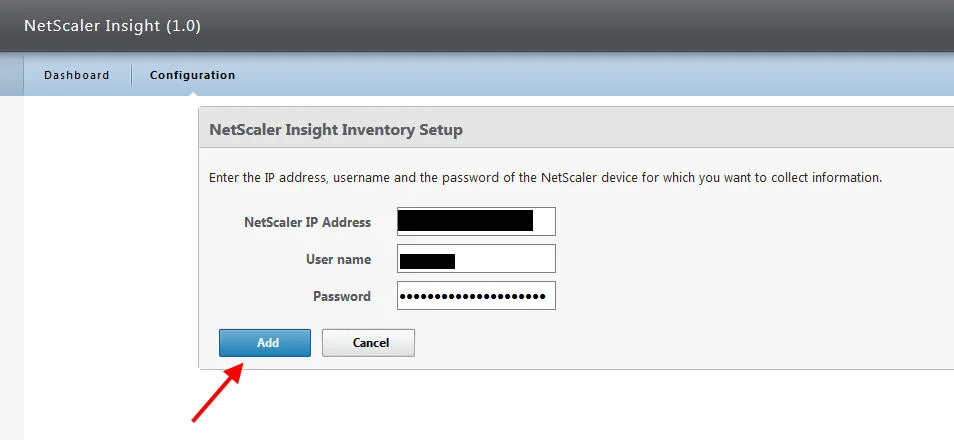
- Click Configuration and add the NSIP and admin credentials of one of your Netscalers. When it connects, it's going to try and enable the AppFlow feature on the Netscaler so you must connect with a privileged account:
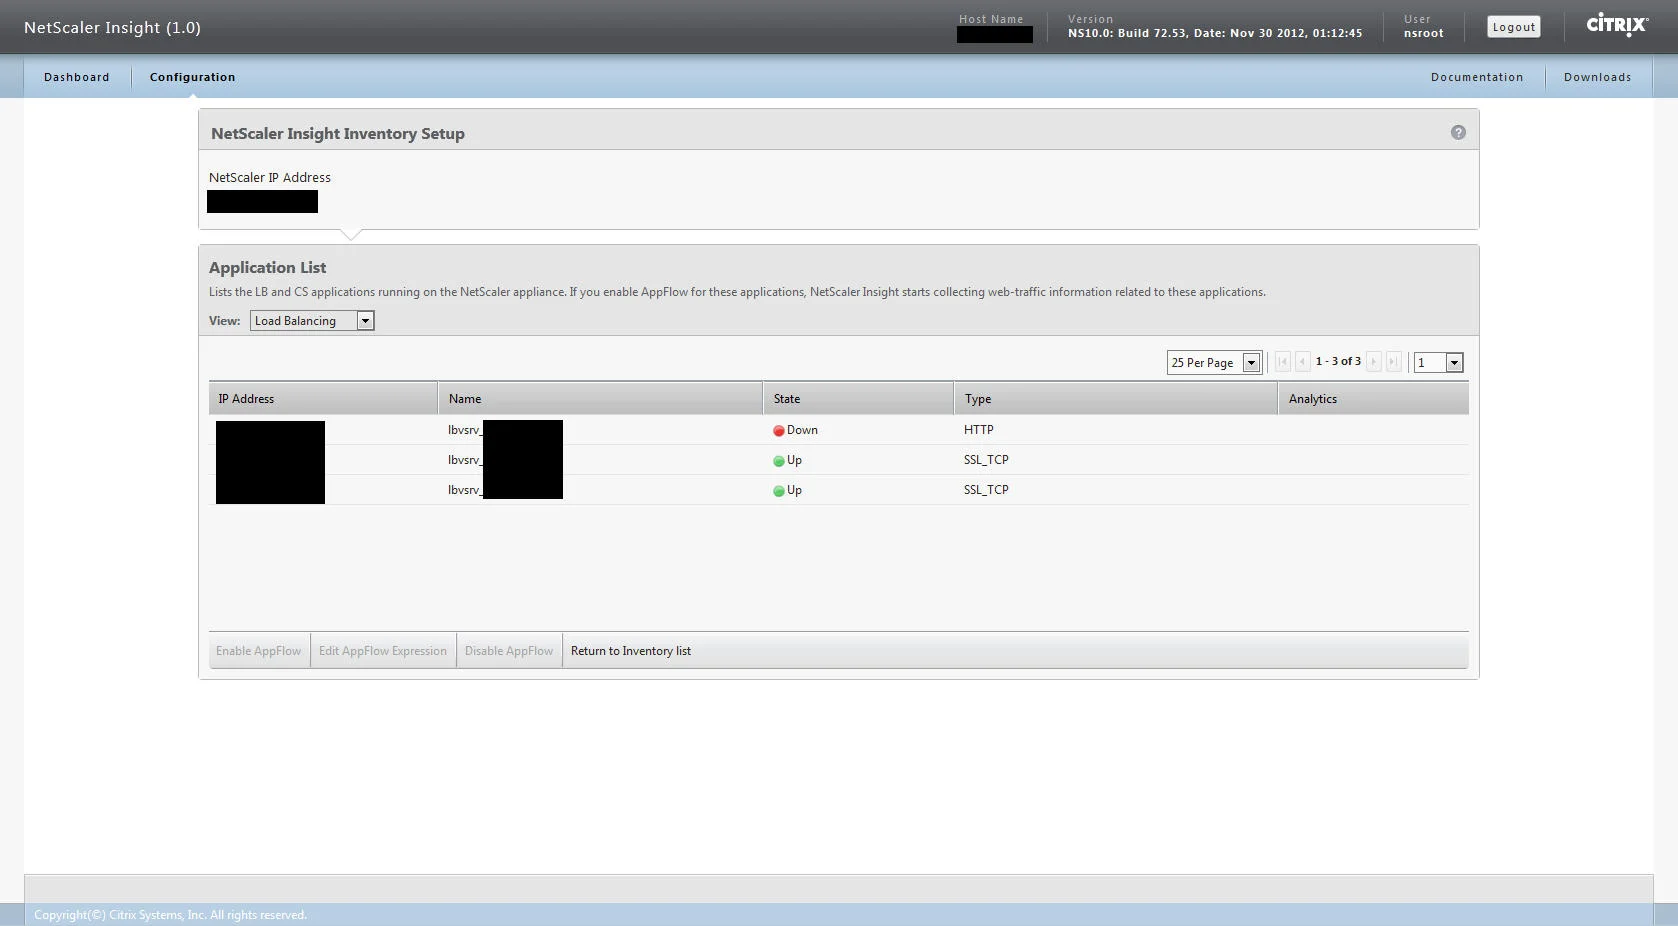
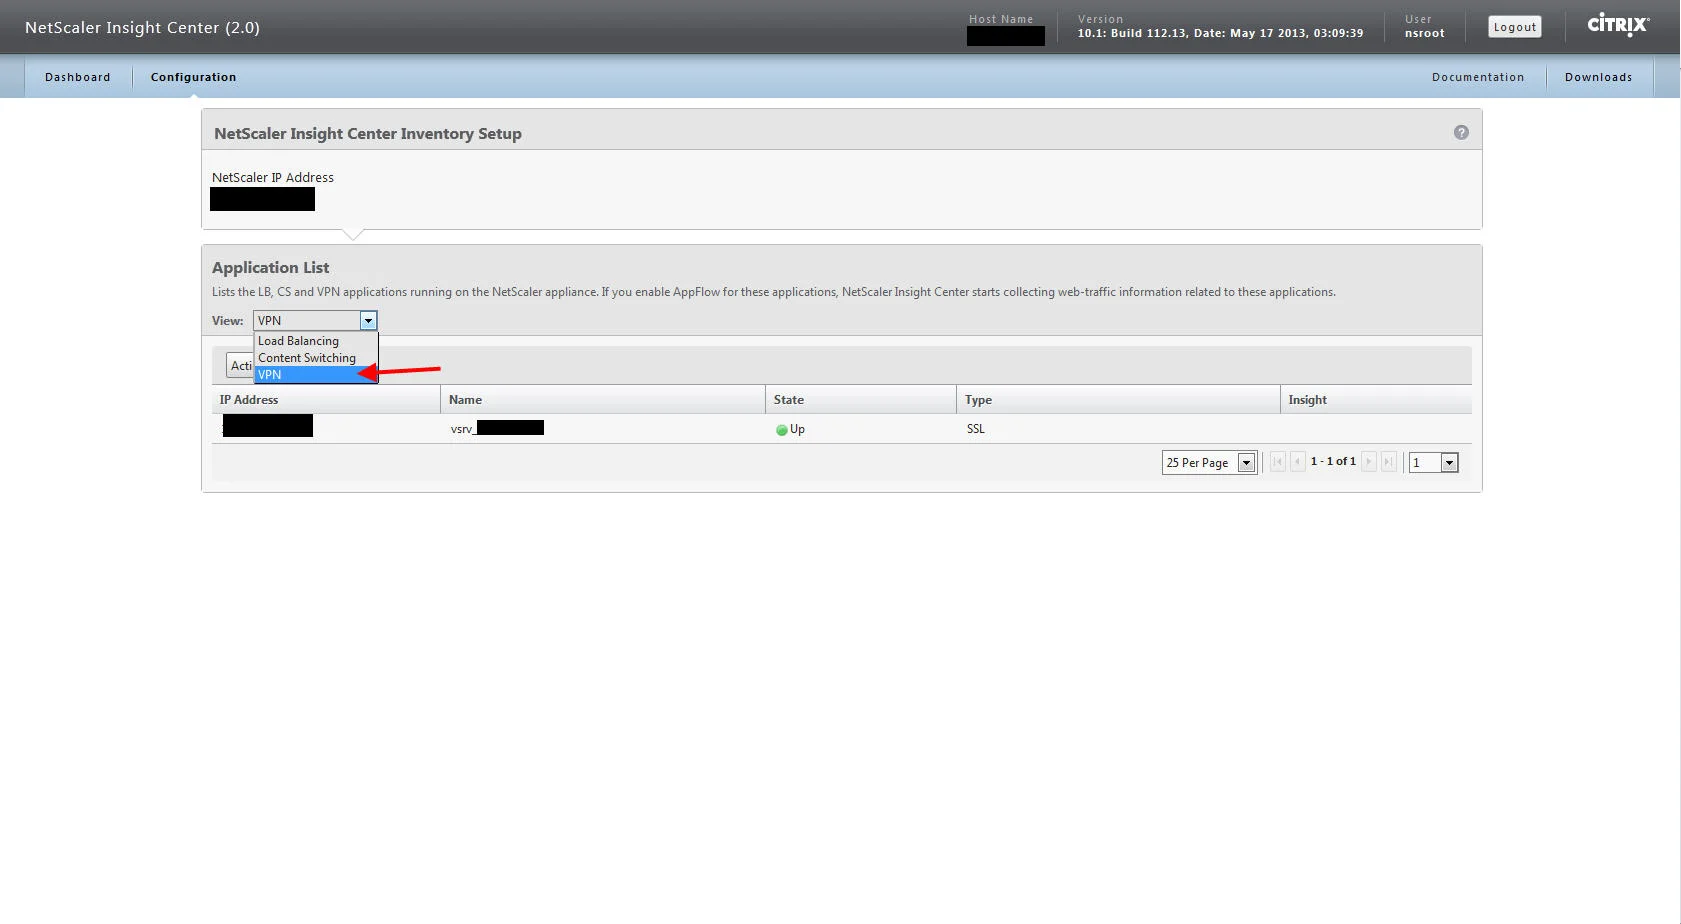
- It immediately saw my 3 load balanced vservers and their states. In the View dropdown, you can select from Load Balancing or Content Switching vservers in the Netscaler Insight 1.0 product.
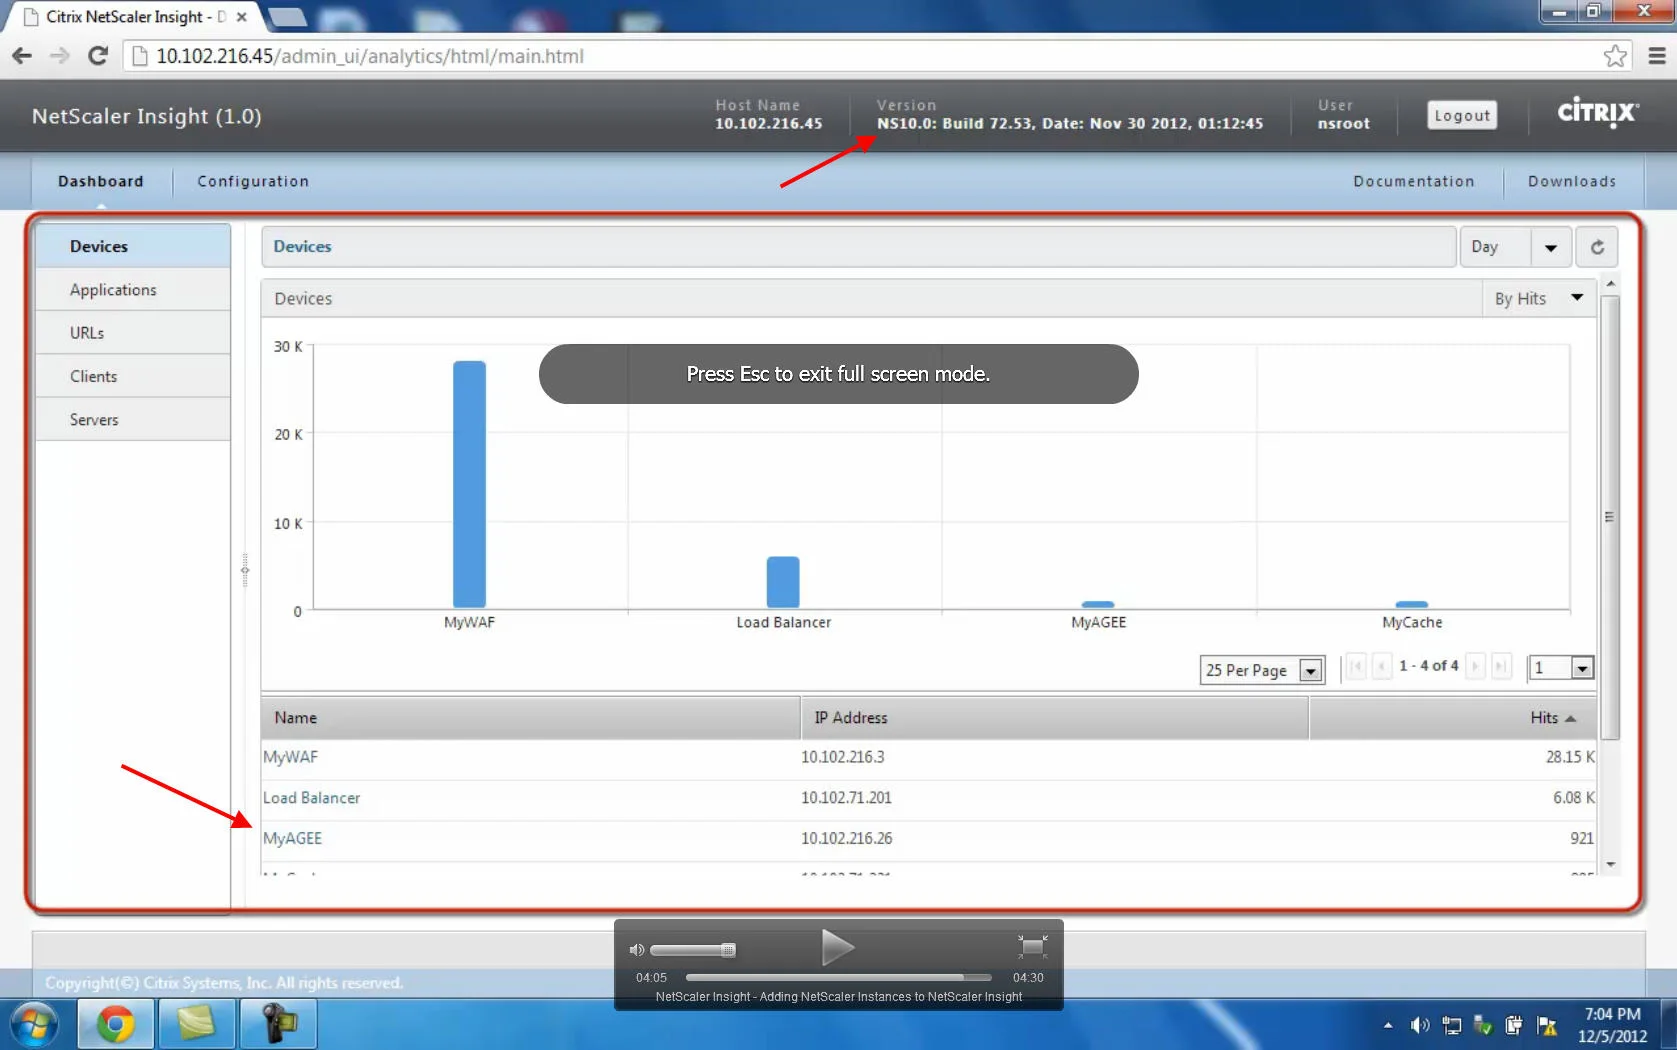
What was really confusing at the time was that the eDocs stated Access Gateway vservers were supported but I could not find any way to view it. Even the one and only video on Insight posted on CitrixTV clearly showed the 1.0 product with the exact same build I had showing AGEE hits:
It wasn't until contacting Citrix, speaking to support who couldn't answer it, and then finally getting a response from the engineering team that I found out the feature would be pushed back a bit into the 2.0 product. Bummer. Not to worry, they assured me it was coming.
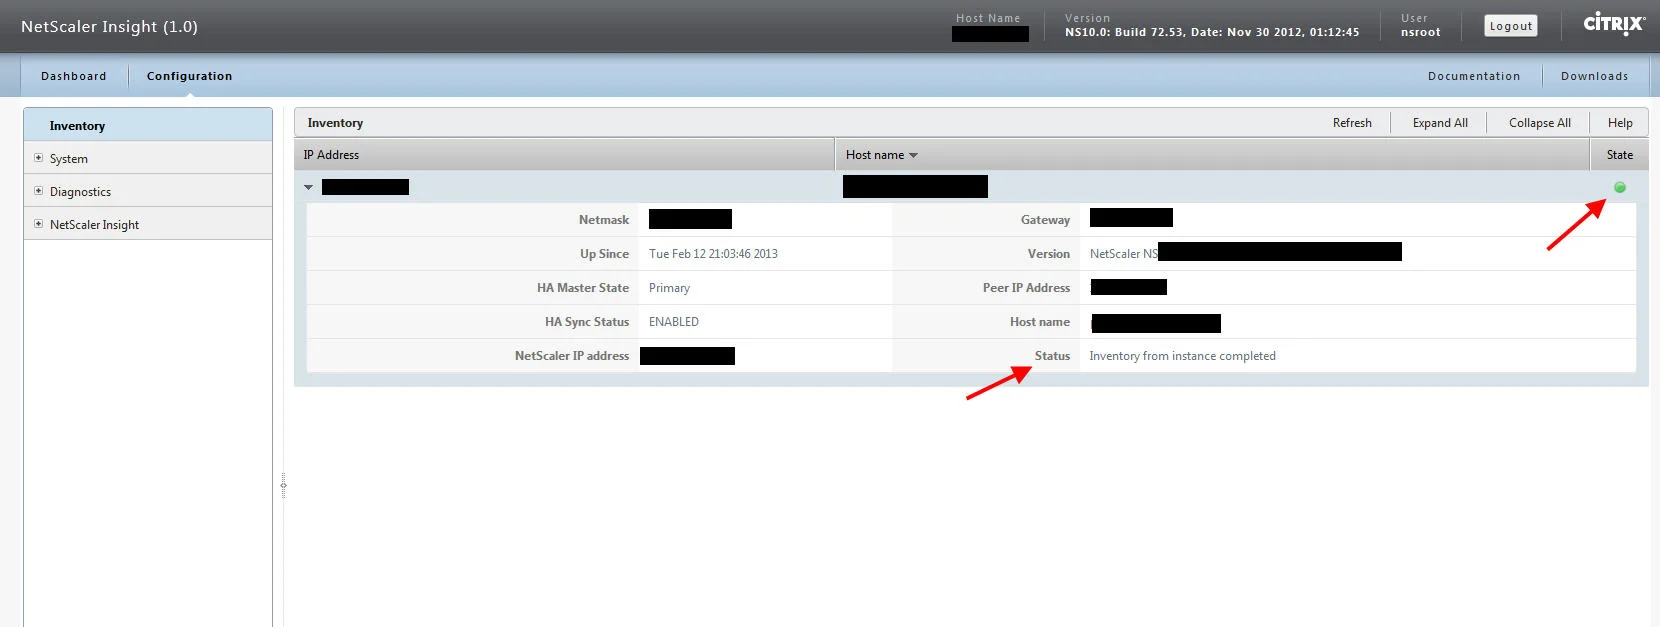
- When you click Return to Inventory list, you will see stats on the Netscaler. The most important thing to note is that green dot under State and the Status. That means it's talking and getting AppFlow data. That's it, you're done setting it up! :)
UPGRADING NETSCALER INSIGHT 1.0 TO INSIGHT CENTER 2.0
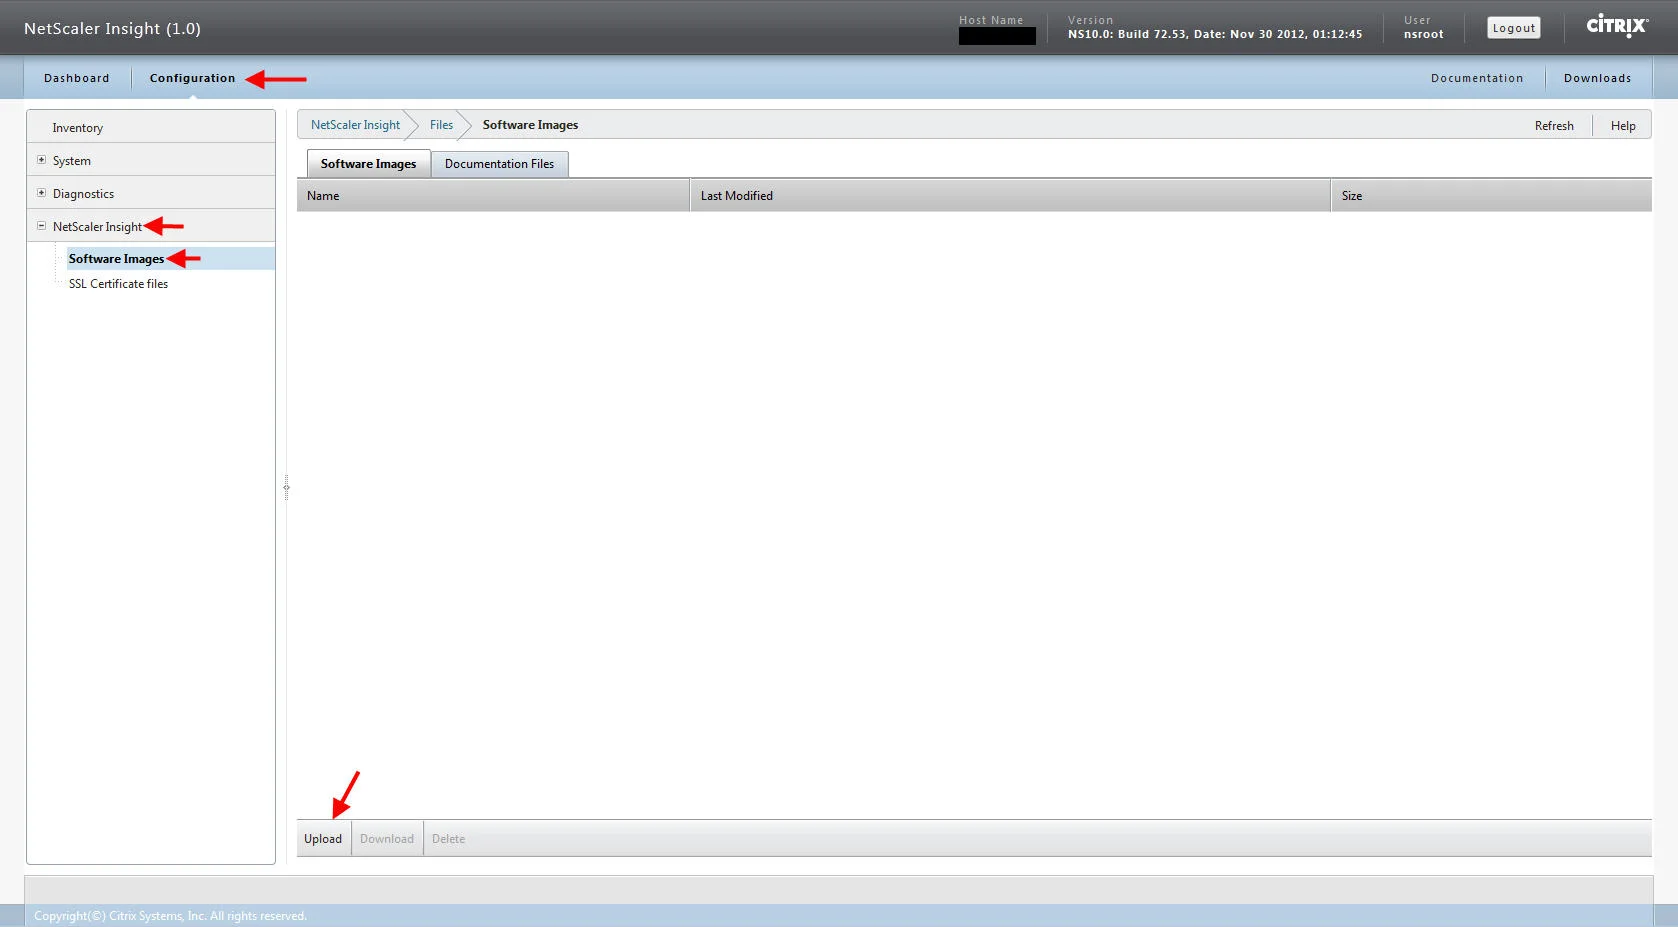
- Now if you went ahead and downloaded the 2.0 appliance, just skip this part entirely. But if you downloaded 1.0 like me and want to upgrade, this is how you do it. I'm assuming you have alread downloaded the NetScaler Insight Center 2.0 Build 112.13 upgrade pack I mentioned in the intro. It's a 90 MB file called build-analytics-10.1-112.13.tgz. You'll need to upload this to the appliance. In the Netscaler Insight web gui, navigate to Configuration > Netscaler Insight > Software Images > click Upload at the bottom and upload the image:
on the Documentation Files tab, you're supposed to be able to upload the latest doc for the build just like a Netscaler appliance but I was not able to find the doc files anywhere on Citrix's website. I am hoping they will add it to the Insight Center download page soon.
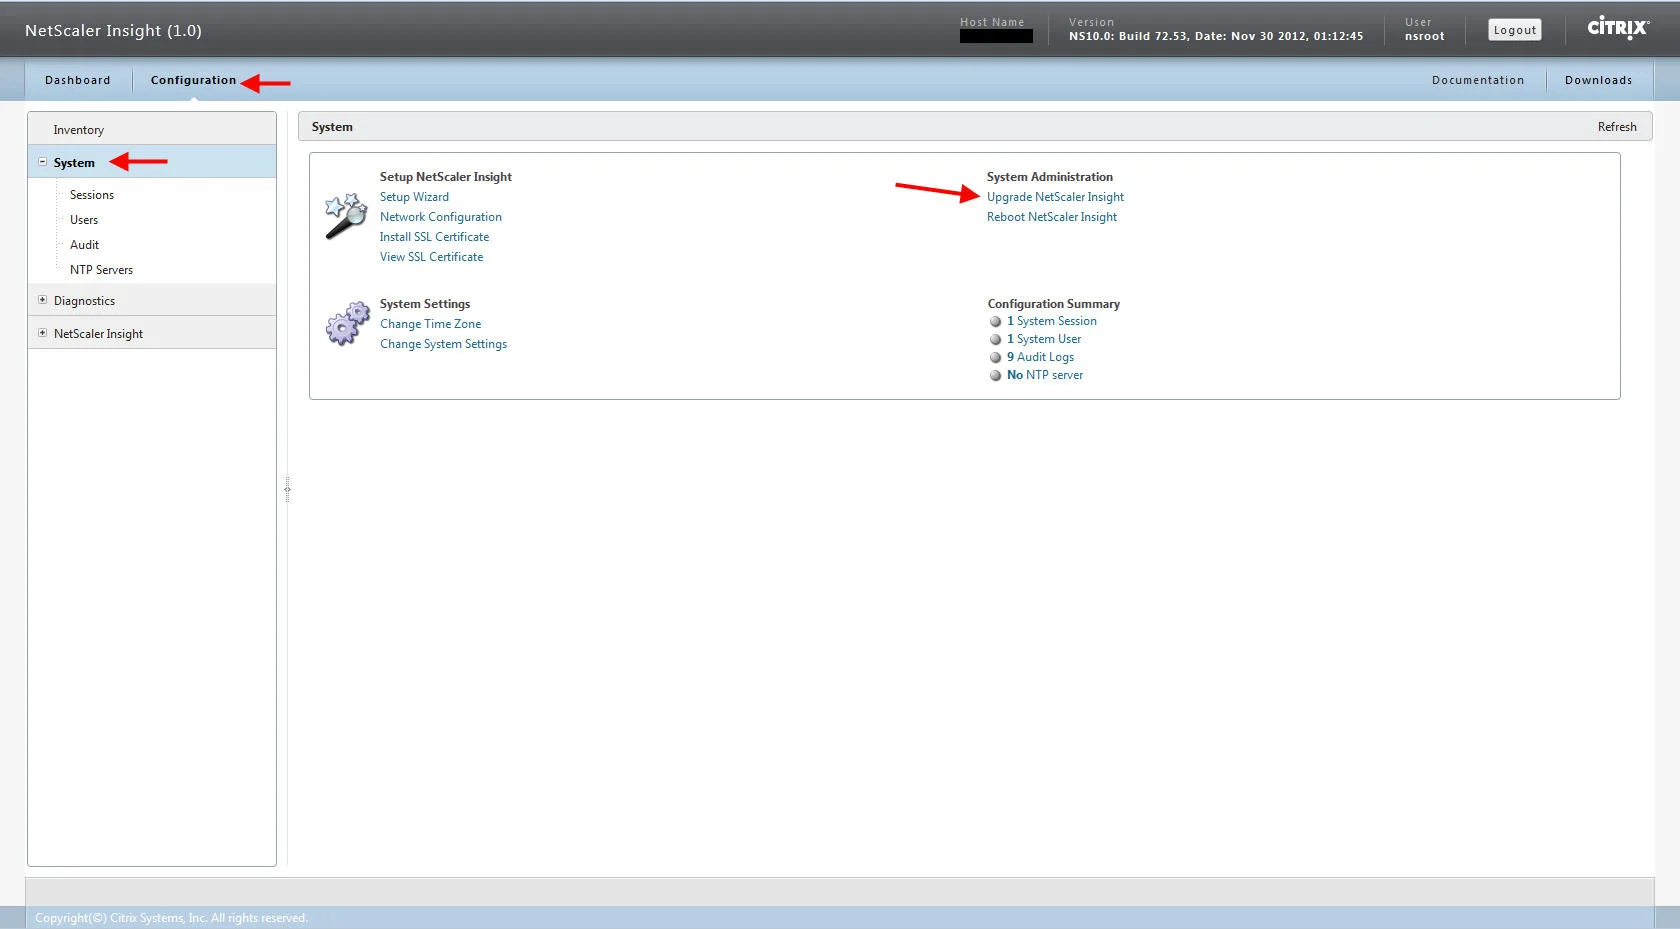
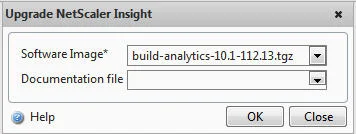
- In the Netscaler Insight Center web gui, navigate to Configuration > System > System Administrator > Upgrade Netscaler InSight
It will automatically choose the image you uploaded. Wish I could find the documentation file that goes with it. I guess I can always update that later. Hit OK and it's going to give you a confirmation prompt, just hit Yes to begin the upgrade.
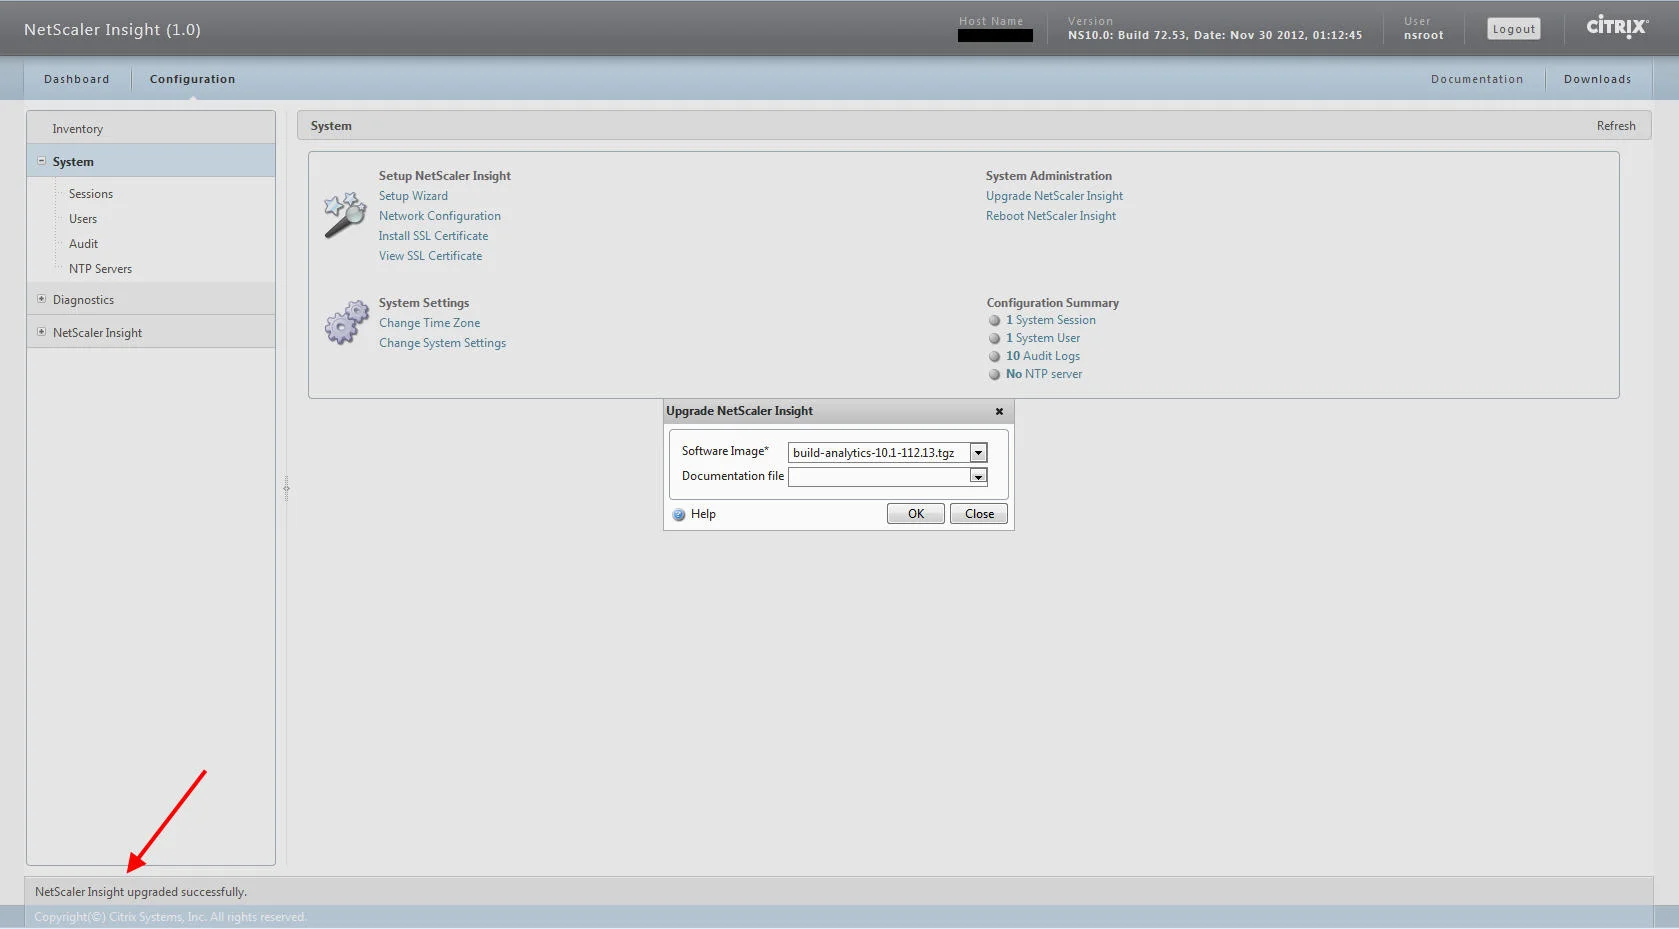
- It should be really quick. The confirmation that it was successful is easily missed because the upgrade dialog will still be open. It's in the bottom left corner. When you click out your session should expire since the system is being rebooted:
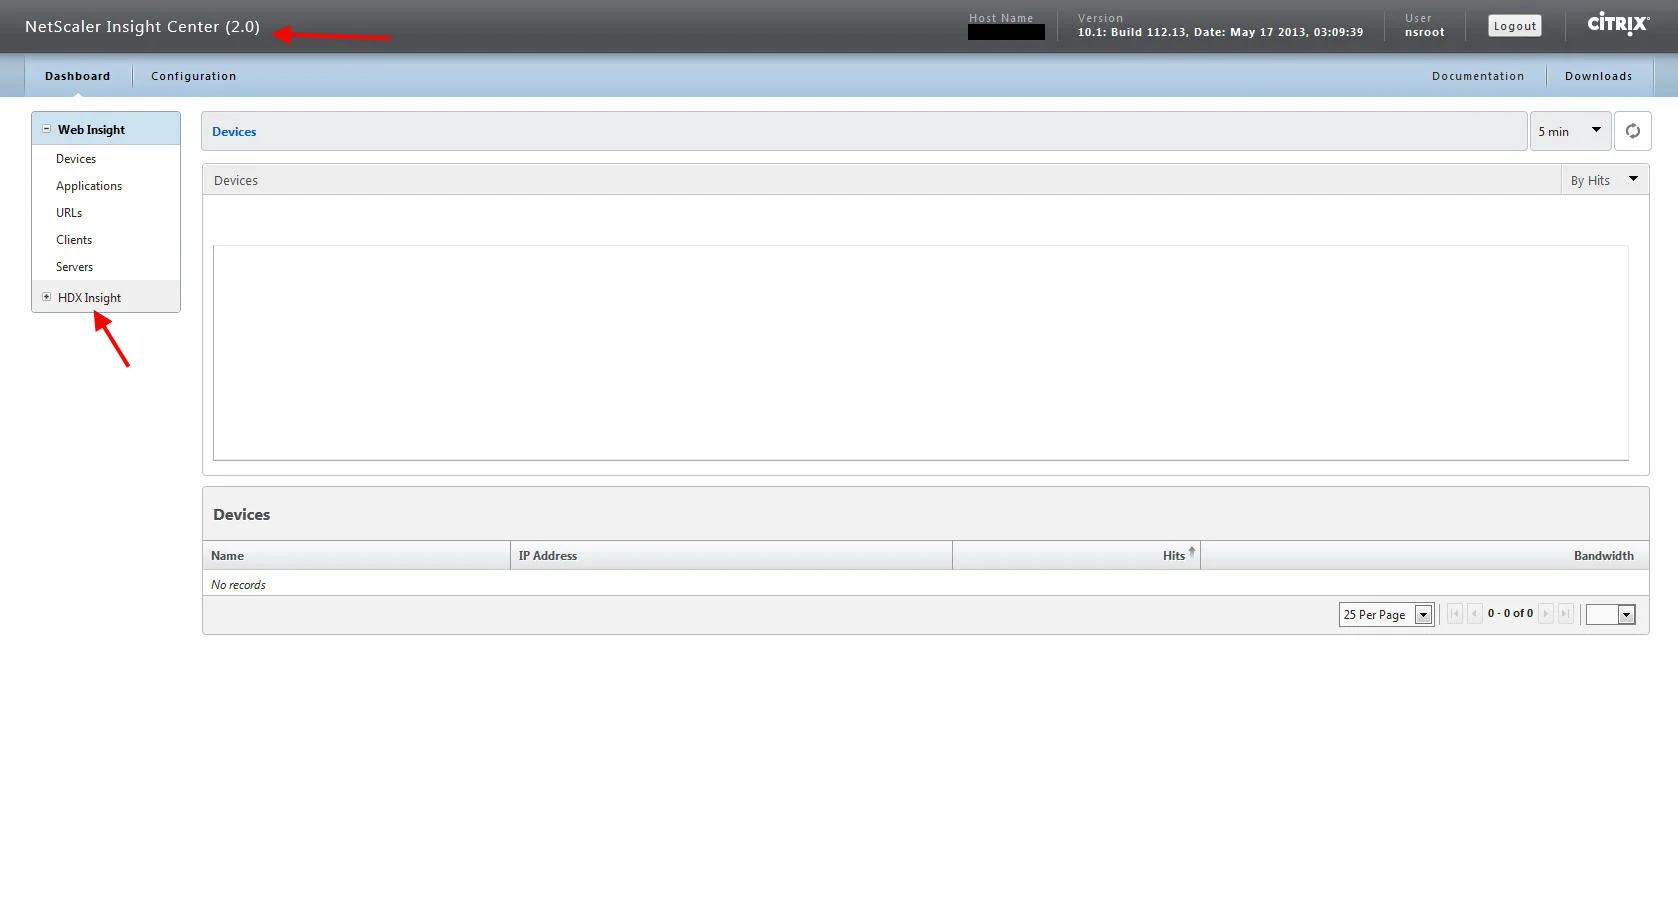
- Log back in and you should see you've been upgraded to Netscaler Insight Center 2.0 in the top left. The dashboard is going to look a little different, traffic is now categorized as Web Insight and HDX Insight. I can't tell you how long I've been waiting to for that HDX Insight piece :) :
- You can also go back to your device configuration and click on your NSIP and you should now see the VPN view in the drop down and any Access Gateway vservers you have. In this example I have just 1:
CONFIGURING INSIGHT CENTER 2.0
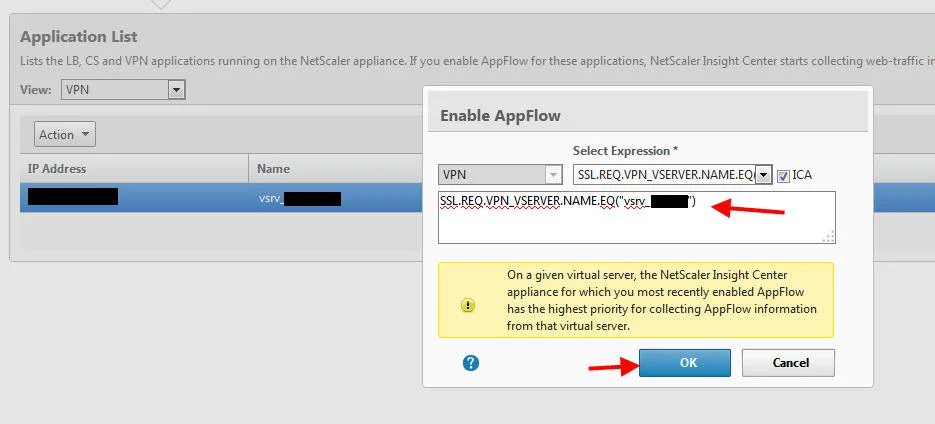
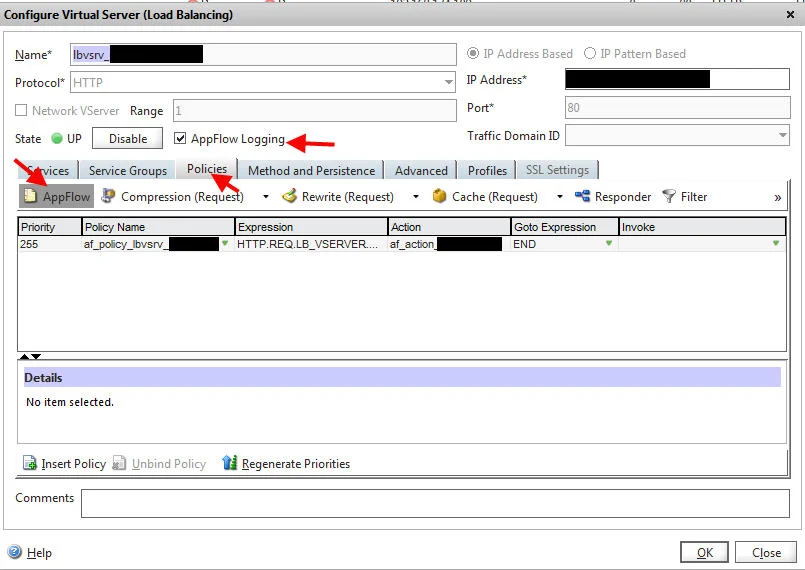
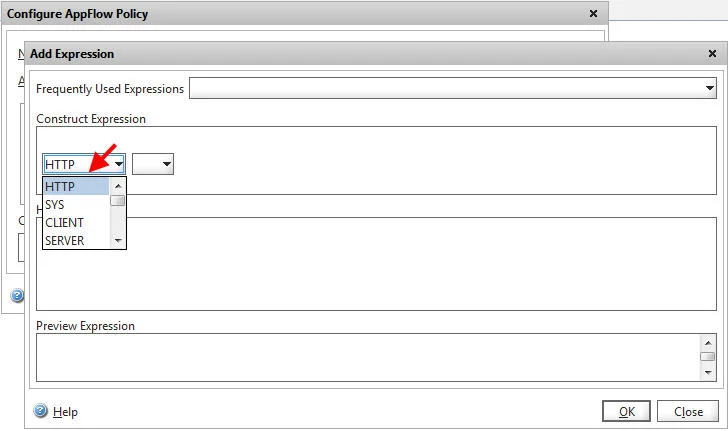
- Right off the bat if you go back to HDX Insight on the dashboard, it's not going to show any data. You might even get a popup error saying "this.chart_y_resources_property is null" or "this._info_cell is null" if you trying clicking around. First make sure you have enabled AppFlow on the Access Gateway vserver. You actually have to do this for any kind of vserver you have (LB, CS, or VPN) so you won't get Web Insight data either until you enable it. You will get no metrics at all then. So go back to the device under configuration, highlight the vserver > click Action > Enable AppFlow. You're going to get a screen like this to select an Expression. I chose SSL.REQ.VPN_VSERVER.NAME.EQ("myvservername") so I could grab everything. MAKE SURE to check the ICA checkbox or you will only see VPN traffic come across.
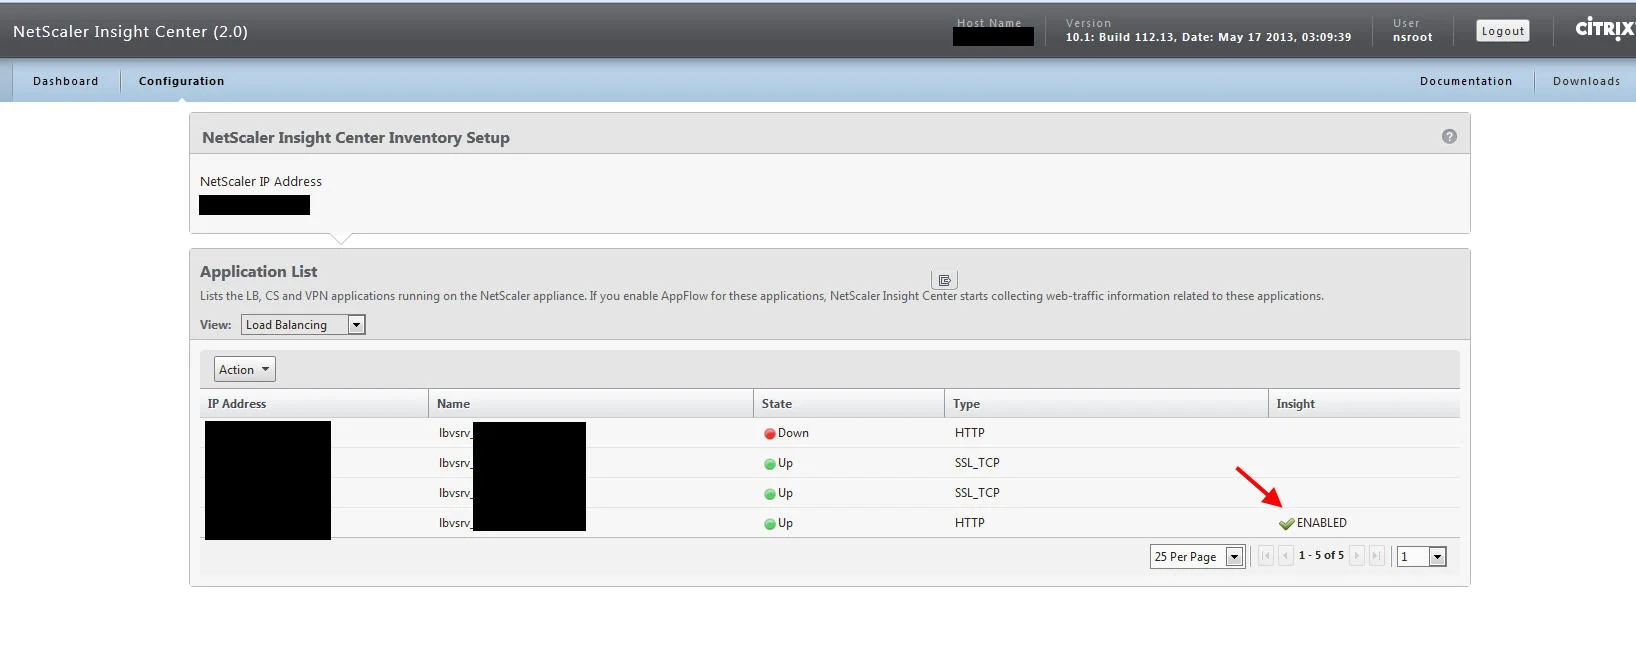
Once it's enabled, you will see it say ENABLED under the Insight column. Here's an example of an LB vserver I enabled it on:
- Secondly, you need to be on NS 10.1 and have a Platinum license to really take advantage of Insight Center and get HDX metrics. NS 10 seems to work too but I have been doing all my testing on 10.1. Remember, Insight Center has requirements for both the firmware and license level of your Netscaler devices to function correctly. If you get error messages when clicking around, it's likely due to this. I actually tried hooking up an NS 9.3 nc device but it did not work. It sort of worked with Insight 1.0 with web traffic. VPX Express devices are not supported with HDX Insight either since it's a free license. I tried with an NS 10.0 VPX Express device during my testing and was unsuccessful pulling HDX Insight metrics. I wish Citrix would reconsider that one because I use VPX Express for testing config changes before applying on my real MPX and VPX devices and not seeing how my config changes are impacting test traffic is going to be a bit of a pain. I want the same visibility across the board from my lab environments to full scale production environments.
While I'm on the subject of feature requests, I'd also like to see the license level of each Netscaler displayed under the Inventory section. Currently it gives you a lot of great info on each Netscaler including the HA status and firmware version number but nothing about licensing. When you own a ton of Netscalers, it might drive you crazy trying to remember what license each has and what metrics are being reflected in the dashboard. If I were open up access to Insight Center to help desk or management, those users are not Netscaler engineers and don't know the nuances of licensing. They might operate on the assumption that everything shown in the dashboard is all Netscaler traffic in the organization when it could certainly be missing a lot of data from non-Platinum devices and there is no way they would be aware of this. Again, the point of Insight Center is total visibility.
- Once you've verified Insight is ENABLED and you are on the right firmware and license level, you may still not get any data. One thing to check is if your AppFlow port is open. Putty/SSH into one of your Netscalers and telnet to your Insight Center IP on port 4739 UDP (not TCP):
telnet xxx.xxx.xxx.xxx 4739
If it doesn't connect, there might be a firewall between the Netscaler and the Insight Center that may be blocking AppFlow traffic. Additionally it appears ports 80 and 443 are also being used. At the time of this writing, there is no eDoc available documenting the ports. I have requested that Citrix update this in the eDocs so hopefully we'll get some official info online soon.
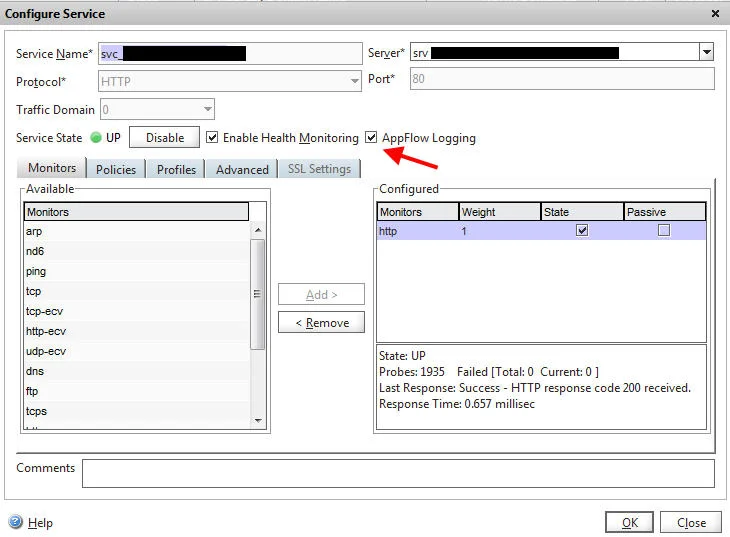
- Verify the AppFlow expression and action were actually created on the Netscaler. I've seen some odd behavior already where Insight Center created a AppFlow policy but no action. Just log into your Netscaler and go to System > AppFlow > Policies and you should see all your policies there. You also have a hit counter so as you generate traffic, you should be able to see the hit counter rise:
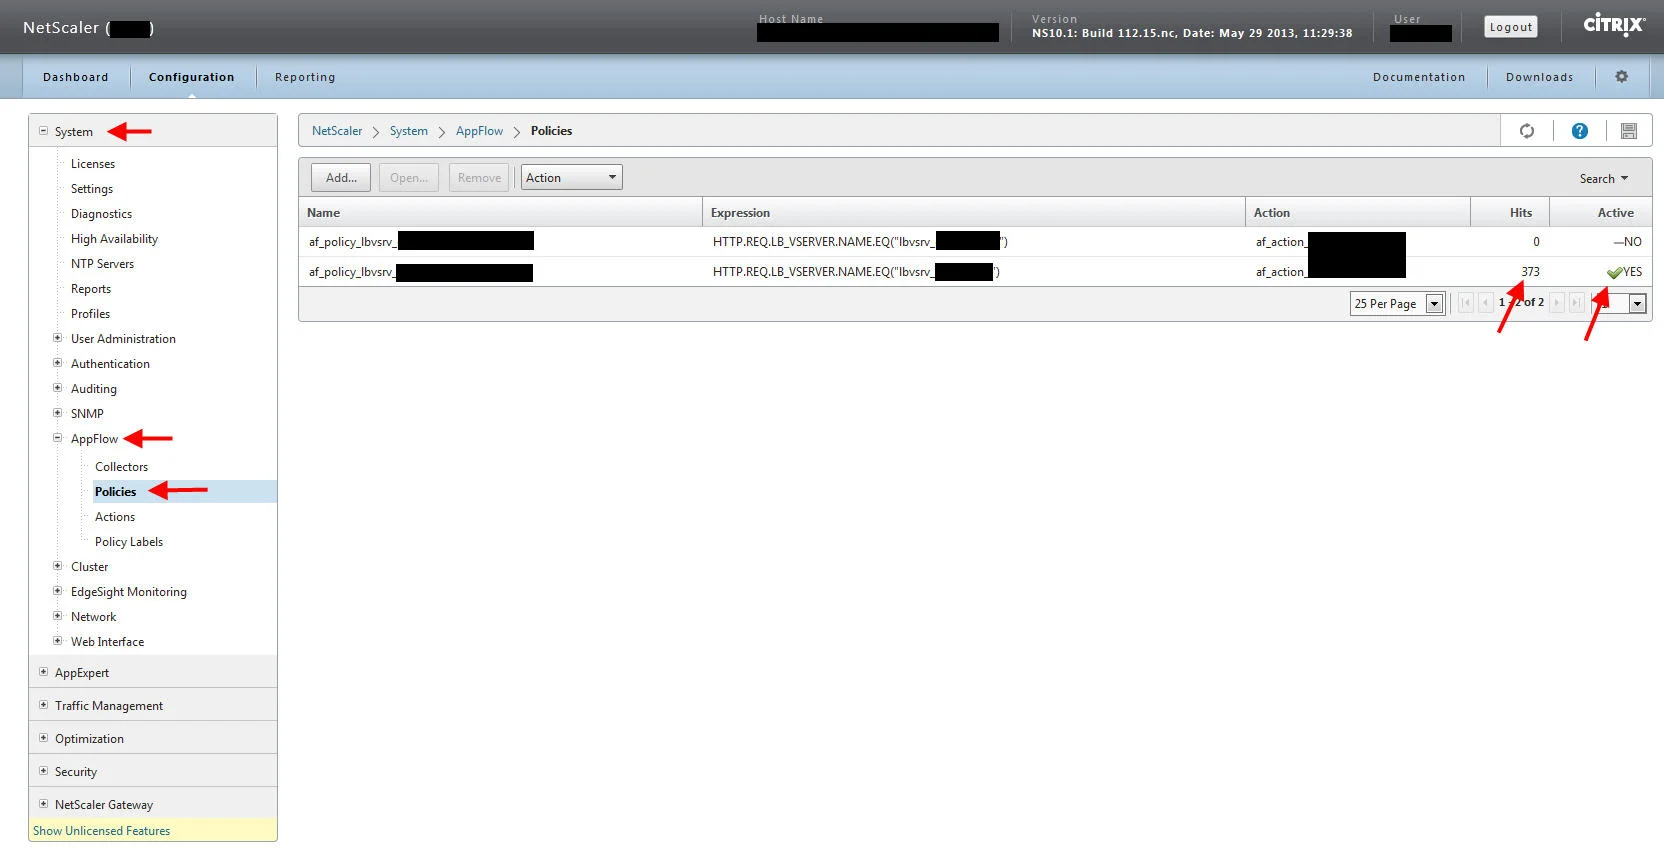
You can also go to each LB, CS, or AGEE vserver as well as services/service groups and check there as well:
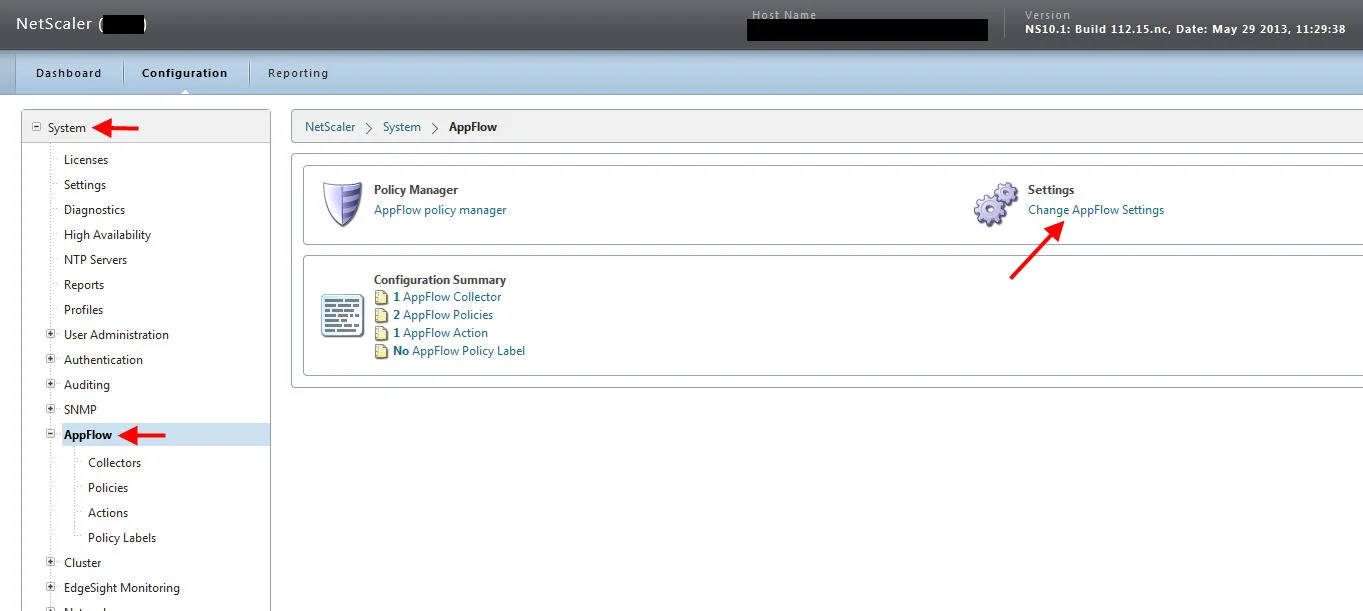
- Make sure AppFlow is actually set to give the data Insight Center is requesting. On your Netscaler under System > AppFlow click on Change AppFlow Settings and make sure all the traffic you want to capture is checked. In my case for testing purposes I checked these. MAKE SURE ICA Traffic is checked:
-
I've had a few issues with Insight Center where I had to enable AppFlow on a vserver, disable it, then re-enable it to get traffic showing. Weird bug but you might want to try that as a troubleshooting step. I actually ran into the problem several times including right after doing a firmware update on a Netscaler. Disabling and re-enabling started pulling traffic again.
-
I ended up having to update Netscaler Insight Center to build Build 112.15 so it would work with a 10.1 Build 112.15 Netscaler appliance. Web Insight traffic works great. HDX Insight on the other hand is not working for me and I have had to open a ticket with Citrix on it. It is currently being escalated up to the engineering team. It seems Insight Center has trouble creating a VPN Appflow policy. Putty into your Netscaler, enter shell, and type:
cd /var/log
then:
tail -f ns.log
then go the Insight Center and try and enable AppFlow on your VPN vserver. You'll see an error in the ns.log when it tries to create the policy:
User nsroot - Remote_ip xxx.xxx.xxx.xxx - Command "set appflow policy af_policy_vsrv_xxxxxx_xxx.xxx.xxx.xxx -rule "SSL.REQ.VPN_VSERVER.NAME.EQ(\"vsrv_xxxxxx\")" -action af_action_xxx.xxx.xxx.xxx" - Status "ERROR: Expression syntax error"
Ok, so expression error. When you go to the Netscaler GUI and try and create the policy manually, SSL is missing. Probably the reason why it's throwing a syntax error:
It's being escalated with Citrix support right now. I'll post an update when I get it. One thing to note, if you go to the firmware download page for 10.1 112.15 it now says in big bold letters "Access Gateway software in 10.1 release is a Tech Preview." so that might be part of the problem.
- One quick point on troubleshooting 10.1 112.15 Netscaler appliances. Trace logs can't be opened in Wireshark 1.10.0 (the latest available). As you might know 10.x appliances require a certain version of Wireshark to view traces. Well with 10.1 there have been changes to the nstrace format and there is no "official" version of Wireshark that can view it yet. The changes were submitted by the Netscaler team to Wireshark and they will reflect in Wireshark 1.11.x when it is released. Until then the workaround is using the nightly builds of Wireshark which reflect the changes or using tcpdump.
FINAL THOUGHTS
Once you get it all configured and talking properly you'll quickly see how invaluable Insight Center can be. Web Insight is working well and I can already see value in that. I'm hoping HDX Insight will be just as impressive when I get it working. I've heard we are just a few weeks away from a new Netscaler 10.1 firmware release so hopefully the kinks have been worked out. Insight Center might not be completely polished just yet but is it definitely headed in the right direction. I'm looking forward to future updates for this product. Please post a comment of your own experiences with it. UPDATE: As of the June 27th Netscaler 10.1 firmware build 118.7, it has fixed the Insight Center issues I have reported. Here are the build 118.7 download links for the both the appliance firmware and Insight Center:
https://www.citrix.com/downloads/netscaler-adc/firmware/release-101-build-1187.html
https://www.citrix.com/downloads/netscaler-adc/components/netscaler-insight-center-101.html Here are the release notes: https://www.citrix.com/content/dam/citrix/en_us/documents/downloads/netscaler-adc/NS_10_1_118_7.html And specifically, what I had reported: "Issue ID 0388453: On the Configuration > Inventory > Application List page, after you right-click a VPN application and select Enable AppFlow, then clear the ICA check-box and click Enable AppFlow, AppFlow is shown enabled, but no data is collected and therefore no reports are displayed on the Dashboard > HDX Insight page." I also noticed this little bit which will make a lot of people happy: "ENH ID 0395659: The ICA AppFlow records of NetScaler Insight Center were previously available only with Platinum licenses of NetScaler appliances. This release supports the Enterprise licenses as well." UPDATE 2: I take that back. Still experiencing some issues. HDX monitoring was working great for a bit but then completely stopped. After speaking with Citrix and again having to escalate to the dev team, I've been told devices with Enterprise licenses still do not pull HDX metrics and the release notes saying it does was an error. The August release will have the real fix. Known issues for the current 118.7 build are being logged here:
http://support.citrix.com/proddocs/topic/ns-rn-main-release-10-1-map/ns-rn-known-issues-10-1-118-x-con.html And here is the note about this issue: Issue ID 0400900: The HDX Insight node is not displayed for Enterprise licenses of NetScaler appliances. Getting real frustrated with Insight Center at this point. Especially since it was actually working for a while before it broke (I was taking screenshots of it working to put up when it broke!). I'm hoping the August release will be thoroughly QAed before being released. These half working 10.1 releases and contradictory information lately is making Citrix look bad in front of my peers. I kind of have a feeling 10.1 was rushed to market for Synergy and XenDesktop 7. I feel bad saying that because Netscaler is a stellar product with a good team of guys supporting it and I've never experienced issues like this in the past. UPDATE 3: Latest version of Insight Center is super solid. Working exactly as expected!

Jason Samuel
Product leader, advisor, and international speaker with 27+ years in enterprise end-user computing, security, and cloud. Has deployed infrastructure at Fortune 500 scale across 34 countries. 1 of 3 people globally to hold Citrix CTP + VMware vExpert + VMware EUC Champion concurrently. 200+ articles, 1,000+ reader discussions.
Previous Comments (11)


Boris Acker :I've noticed the crashing with 118.7 as well and have been providing Citrix with logs almost weekly. They have a solution and are finalizing it. The build will be 119.7 and will be posted online soon.You will need to update both appliances with version 118.7
However as I experienced personally, there is a bug in version 118.7 which causes the NetScaler to crash. This will be fixed in the upcomming maintenance release (August 2013).To work around this, Citrix recommends to disable the firewall feature; however I haven’t tried this yet.