This is a quick reference guide/cheat sheet of links and commands every Enterprise Mobility, EUC (End User Computing), SBC (Server Based Computing), VDI (Virtual Desktop Infrastructure), Security, or Cloud focused engineer should know about. I will remove stuff that gets deprecated so the page doesn’t get too cluttered.
Citrix living CTXs
These are critical parts of Citrix infrastructure and you always have to keep up with the latest news on these:
- http://support.citrix.com/article/CTX139331 – Citrix Virtual Desktop Handbook 7.x
- http://support.citrix.com/article/CTX127939 – XenDesktop 7.x SQL Database Sizing and Mirroring Practices
- http://support.citrix.com/article/CTX131239 – XenDesktop and PVS Hypervisor support
- https://docs.citrix.com/en-us/tech-zone/build/tech-papers/antivirus-best-practices.html – Citrix & Antivirus settings
- http://www.citrix.com/events/citrix-user-group.html – Upcoming Citrix User Group meetings in your city or online webinars
- http://support.citrix.com/article/CTX127998 – SQL Database Access and Permissions Necessary for XenDesktop & XenApp 7.x
- https://www.citrix.com/go/citrix-developer/netscaler-developer-community/howto-guides.html – Citrix NetScaler Common Configuration How-To guides
- http://support.citrix.com/article/CTX208792 – NetScaler Cheat sheets for XenMobile Integration
- http://support.citrix.com/article/CTX208788 – XenMobile WorxMail Cheat Sheet
- http://support.citrix.com/article/CTX208791 – XenMobile Device Enrollment Cheat Sheet
- http://support.citrix.com/article/CTX212665 – XenMobile Client Certificate Authentication Cheat Sheet
- https://support.citrix.com/user/alerts – Citrix product alerts. Select your products and get important updates as they happen.
- https://support.citrix.com/article/CTX227560 – NetScaler Logs Collection Guide
- https://support.citrix.com/article/CTX215130 – HDX Insight Diagnostics and Troubleshooting Guide
Microsoft living KBs
- http://social.technet.microsoft.com/wiki/contents/articles/953.microsoft-anti-virus-exclusion-list.aspx – Microsoft Anti-Virus Exclusion List (very important for Citrix as well. Things like MMC, Powershell, DAT files, etc. should be excluded or apps like Citrix Studio that are heavily dependent on these will be extremely slow. Symantec Anti-virus (SAV) or Symantec Endpoint Protection (SEP) for example will rtvscan.exe or ccSvcHost.exe on each and every user .dat file when opening Citrix Studio.)
VMware living KBs
These are critical parts of VMware vSphere infrastructure and you always have to keep up with the latest news on these:
- http://www.vmware.com/resources/compatibility/search.php – VMware Compatibility Guide (host server, guest OS, storage, etc.)
- http://kb.vmware.com/selfservice/microsites/search.do?language=en_US&cmd=displayKC&externalId=2100429 – Host operating system support information
- http://kb.vmware.com/selfservice/microsites/search.do?language=en_US&cmd=displayKC&externalId=2009918 – Rebuilding indexes to improve the performance of SQL Server and Oracle vCenter Server databases
- http://kb.vmware.com/selfservice/microsites/search.do?language=en_US&cmd=displayKC&externalId=1007453 – Reducing the size of the vCenter Server database when the rollup scripts take a long time to run
iVanti/AppSense User Workspace Management
- https://www.myappsense.com/Knowledgebase/TN-150728.aspx – Recommended AppSense DesktopNow anti-virus exclusions (login required)
Citrix Virtual Apps and Desktops (XenDesktop and XenApp) Powershell cmdlets
- Enable Citrix powershell snap-ins for XenDesktop/XenApp 7.6:
Add-PSSnapin Citrix.*.Admin.V* - Enable Citrix powershell snap-ins for XenApp 6.5:
Add-PSSnapIn citrix.xenapp.commands

Add-PSSnapIn citrix.common.Commands

Add-PSSnapIn citrix.common.groupPolicy - To get a listing of all your XenApp 6.5 servers:
get-xaserver | select servername > c:\temp\XenApp_VM_list.txt - To get a listing of XenDesktop logged in users:
get-brokersession | select UserName > c:\temp\logged_in_users.txt - To get a listing of ALL XenDesktop/XenApp 7.6 VMs:
get-brokermachine -maxrecordcount 2000 | select machinename > c:\temp\VM_list.txt - To send a reboot notification message to a specific desktop group on XenDesktop/XenApp 7.6:
Add-PSSnapin citrix*

$sessions = Get-BrokerSession -MaxRecordCount 5000 | Where {$_.desktopgroupname -match "Virtual Desktop Group 1"}

Send-BrokerSessionMessage $sessions -MessageStyle "Information" -Title "REMINDER: Virtual Desktop Reboot @ 11 PM" -Text "REMINDER: Virtual Desktops will be rebooted Saturdays @ 11 PM. Please save your work and logoff prior to this when you go home for the day. If you work from home you will be logged off at 11 PM but can immediately log back in after the 11 PM reboot." - To get a list of all published applications being used along with associated user names in a XenApp 7.x environment:
Add-PSSnapin Citrix.*.Admin.V*

get-brokersession -maxrecordcount 20000 | select ApplicationsInUse, DesktopGroupName, UserName, UserUPN, ClientName, ConnectedViaIP, AppState, EstablishmentTime | Sort-Object ApplicationsInUse > c:\temp\citrix-apps-launched-right-now.txt - This one is not PowerShell and can be run from a regular CLI on any endpoint a VDA is installed on. It will let you see details of the ICA connection and wether you are using TCP or UDP for the ICA connection. Very helpful to detect if you are truly using HDX Adaptive Transport/HDX Enlightened Data Transport Protocol or verifying Session Reliability/CGP is working (port 2598 vs. 1494), bandwidth, and latency:
ctxsession -v
VMware PowerCLI scripts
- Reboot specified VMs in a controlled fashion. I use a modified version of James Green’s PowerCLI script. Comes in very handy for Citrix PVS/Atlantis USX environments that require weekly reboots. It is always better to initiate reboots at the host level in case any VMs are stuck on boot and won’t respond to agent or OS based reboot instructions. I’ll link you directly to James’s work instead of posting my customized version for PVS, it’s essentially the same:
Scheduled VM Reboots with PowerCLI
VMware ESXi host tuning for Virtual Apps and Desktops (XenApp and XenDesktop) workloads
Over the course of my career I’ve come across a few tips to share on server host tuning for XenApp/XenDesktop workloads using the VMware vSphere ESXi hypervisor. The hypervisor layer can be made to perform better than the out of the box config for almost all workloads, especially for XA/XD workloads. Some of these tips have now become standard in out of the box configurations with newer versions of ESXi but you should still be aware and check these settings in your environment. The first set of tips is more storage centric and I’ve used these settings for NetApp filers to software defined storage (SDS) like Hive-IO/Atlantis USX.
- When using NFS storage, set NFS heart beat frequency to 12:
NFS.HeartbeatFrequency = 12 - When using NFS storage, set NFS heart beat timeout to 15:
NFS.HeartbeatTimeout = 15 - When using NFS storage, set NFS heart beat max failures to 10:
NFS.HeartbeatMaxFailures = 10 - When using NFS storage, set NFS max queue depth to 64:
NFS.MaxQueueDepth = 64 - When using NFS storage, using the vSphere CLI you can disable NetQueue on the host if you see your CPUs running hot. This is referenced at in the VMware Docs as well as page 93-96 of the “vSphere High Performance Cookbook“:
esxcli system settings kernel set -s netNetqueueEnabled -v FALSE - When using NFS storage, using the vSphere CLI you can set the RPC timeout for Deletes to 30 seconds instead of the default 10 seconds. This will help with large files on NFS and failure messages. In an XA/XD world this can be things like write cache for non-persistent environments (PVS/MCS enviros) that need to be deleted. This is also referenced in a VMware KB:
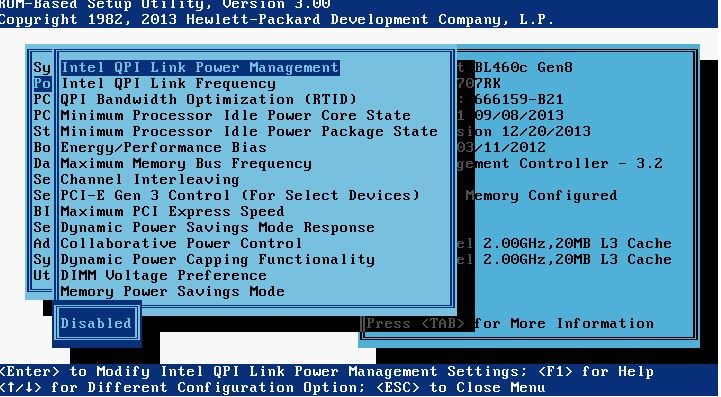
esxcfg-advcfg -s 30 /NFS/DeleteRPCTimeout - On HP servers, set the BIOS Energy/Performance Bias to Maximum Performance:
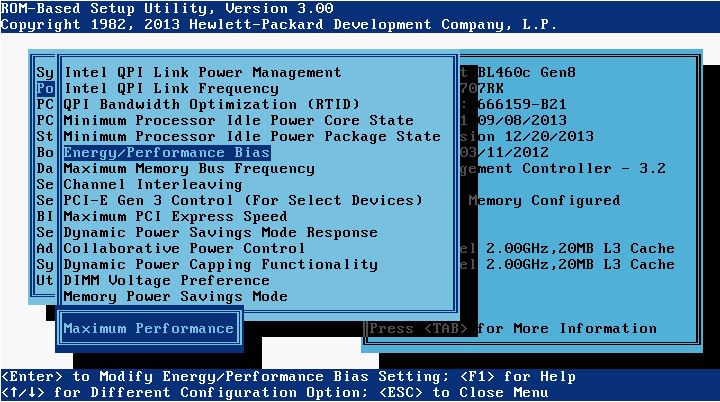
- On HP servers, set the Memory Power Savings Mode to Maximum Performance:

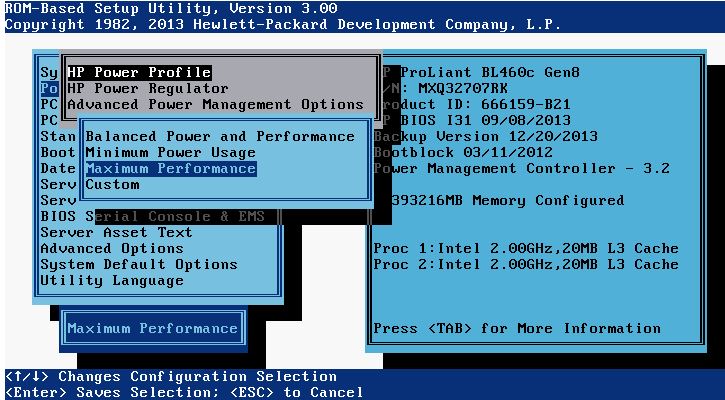
- On HP servers, set the HP Power Profile to Maximum Performance:
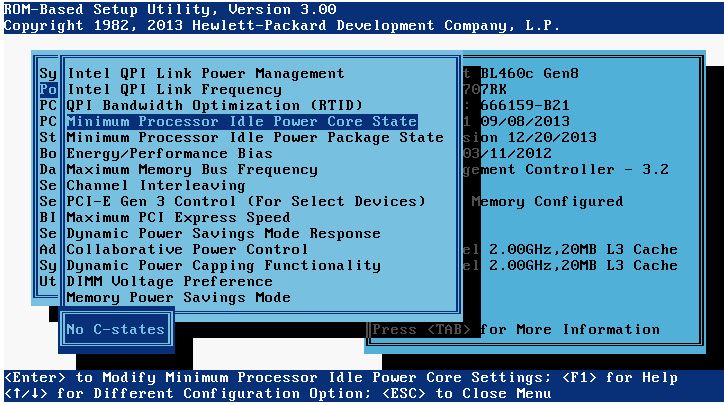
- On HP servers, set the Minimum Processor Idle Power Core State to No C-states:
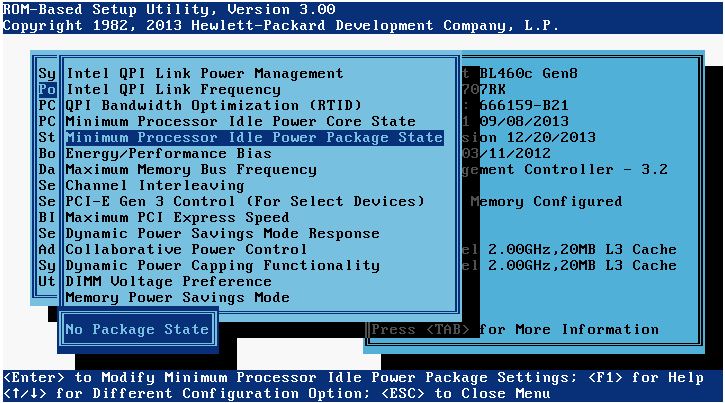
- On HP servers, set the Minimum Processor Idle Power Package State to No Package State:
- On HP servers, set the DIMM Voltage Preference to Optimized for Performance:
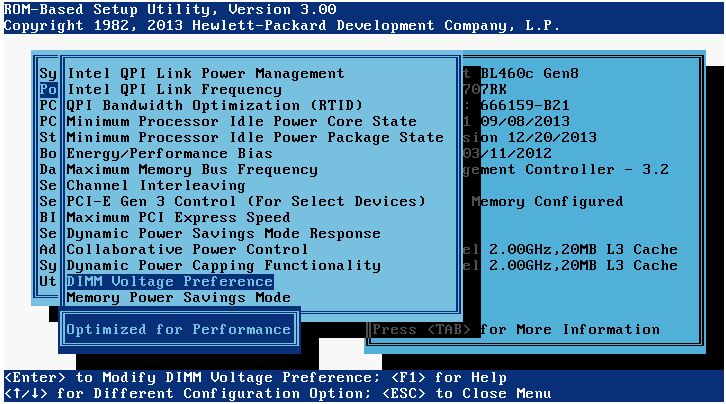
- On HP servers, set the Intel QPI Link Power Management to Disabled:


Citrix ADC (Citrix NetScaler) commands
- Generate an SSL key and csr from a conf file for an SSL SAN certificate (with the expectation you have created a valid .conf file with all SAN names and uploaded already). Your conf file should look something like this:
12345678910111213141516171819[req]distinguished_name = req_distinguished_namex509_extensions = v3_reqprompt = no[req_distinguished_name]C = USST = YourStateL = YourCityO = YourCompanyNameOU = ITCN = netscalergateway.yourdomain.com[v3_req]keyUsage = keyEncipherment, dataEnciphermentextendedKeyUsage = serverAuthsubjectAltName = @alt_names[alt_names]DNS.1 = storefront.yourdomain.comDNS.2 = callbackint.yourdomain.comDNS.3 = callbackext.yourdomain.com
After entering shell:
cd /nsconfig/ssl
followed by:
openssl req -new -newkey rsa:2048 -keyout 2015_KEY_yourdomain.key -out 2015_CSR_yourdomain.csr -config 2015_REQ_yourSANcert.conf
and enter a PEM passphrase for the key file. Send the resulting CSR file into your SSL cert vendor. They will send back a .cer file. Go to step 2 below to convert to a pfx with the key included. Go to step 3 to convert pfx to pem so you can install it on the NetScaler and actually use the cert. - Convert a .cer SSL cert and SSL key to .pfx format using openssl:
openssl pkcs12 -export -out 2015_CER_yourdomain.pfx -inkey 2015_KEY_yourdomain.key -in 2015_CER_yourdomain.cer - Convert a .pfx (SSL cert and SSL key) to .pem format using openssl:
openssl pkcs12 -in 2015_CER_yourdomain.pfx -out 2015_CER_yourdomain.pem - If you get an “Invalid private key, or PEM pass phrase required for this private key” error message when attempting to install your .pem and private key on your NetScaler, this is because of a hidden space issue with the key. You will not be able to bind the cert to your vserver, it will complain it is not a Server Certificate when you attempt to bind. Run the commands below in your NetScaler SSH window to convert your key and re-install the cert using this new key. It will install without error this time. Also, click the little black arrow next to the cert after installing which will expand it. You should see your new key in the “Key File Name” section which confirms the cert is linked to the key properly:
shell

cd /nsconfig/ssl

openssl rsa -in 2015_KEY_yourdomain.key -out 2015_KEY_yourdomain_2.key - Watch NetScaler Gateway logins in realtime (AAA debugging) and log to a file:
shell
followed by:
cat /tmp/aaad.debug | tee /tmp/aaa-log-mm-dd-yyyy.log
**TIP: I absolutely LOVE to use CMTrace to run through these logs quickly. Will highlight rejects and errors automatically. I highly recommend this for any NetScaler engineer. - See all connections to the NetScaler:
shconnectiontable - See all Established connections to the NetScaler from a certain IP and omit Monitors:
sh connectiontable "ip == xxx.xxx.xxx.xxx && svctype != MONITOR"NOTE: If you get this message:Warning: Classic policy expressions are deprecated – use Default (Advanced) policy expressions instead; the nspepi utility may be helpful in conversionyou are running a 12.0 or higher build likely. You need to use:sh connectiontable "connection.ip.eq(xxx.xxx.xxx.xxx) && connection.service_type.ne(MONITOR)"For more info on advance policy expression usage you can go to: https://developer-docs.citrix.com/projects/netscaler-command-reference/en/12.0/ns/ns-connectiontable/ns-connectiontable/ - See all connections to the NetScaler from a certain IP and only display SSL:
sh connectiontable "ip == xxx.xxx.xxx.xxx && state == established && svctype == SSL" - See all connections to the NetScaler that are NOT Monitors or SSL:
sh connectiontable "ip == xxx.xxx.xxx.xxx && svctype != MONITOR && svctype != SSL" - Watch NetScaler policy hits in realtime:
shell
followed by:
nsconmsg -d current -g pol_hitsNOTE: If you notice you’re not seeing all policy hits, you may be running a 12.0 or higher firmware. In 12.0 or higher firmware this command only shows classic policy hits. If you want to see session and advanced policy hits (like those used for advanced authentication policies) you need to use the following command as well. Note that pcb_hits is not a replacement for pol_hits, you need to use both to get a full picture of what all is being hit. You can have 2 Putty SSH windows open (use the Duplicate Session option) and run both commands side by side if you like:
nsconmsg -d current -g pcb_hitsAlternatively, you can look for just the word “hits” which will give both plus a bunch more data to look at. It may be hard to find what you’re looking for on NetScalers with a lot of traffic when doing this:
nsconmsg -d current -g hits - Watch latest ns.log events in realtime (even GUI clicks since they are “show” commands):
shell
followed by:
tail -f /var/log/ns.log - Change the NetScaler theme from a Custom theme to Default theme via CLI if after a firmware upgrade you are unable to login via GUI anymore (“Login command failed over API. Reason: Response not of type test/xml: test/html” bug). Once you’re back in you can change back to custom using the GUI. Make sure your password does not contain special characters as that can prevent login too (“/login/do_login” bug):
set vpn parameter UITHEME DEFAULT

save ns conf

reboot - Change the password on nsroot or other user account via command line:
set system user nsroot MyNewPassword54321

save ns conf - NetScaler licensing is via Host ID, Serial Number, or MAC Address depending on the platform. Sometimes the System page won’t show the MAC address under the Host ID. To find the true MAC address (FlexNet host ID) you need to allocate licenses to, go to:
shell
followed by:
lmutil lmhostid - Find and delete ghost bindings in the running config that don’t show in GUI (AppFlow used as example). You use the sh run command and grep with the i switch to filter for what you are looking for in the config like this. The i switch ignores case and you can leave it out if you want to look for specific UPPERCASE or lowercase objects in the config:
sh run | grep -i af_policy_vsrv_gw_192.168.1.10
and the bound vserver will show. To unbind the policy:
unbind vpn vserver vsrv_gw -policy af_policy_vsrv_gw_192.168.1.10
To find an object (AppFlow collector used as example):
sh run | grep af_collector_192.168.1.20
To remove the object:
rm appflow af_collector_192.168.1.20 - Troubleshooting AppFlow from NetScaler to NMAS or Insight Center. The most common ports NMAS requires to communicate with your NetScaler are:TCP 22,80,443
UDP 161,162, 514, 4739TCP ports are used for discovery and configuration changes. The UDP ports are for SNMP (161,162), SYSLOG (514), and AppFlow (4739). AppFlow is an IPFIX based protocol where traffic is multicast and will flow from the NS to the NMAS appliance one way.In this example:
192.168.150.20 = DMZ NetScaler
172.12.40.10 = NMAS appliance in another subnet seperated by firewallOn your NetScaler run:
shellIf you see traffic being sent to the NMAS appliance and no response, this is good and how it should work.On your NMAS appliance run:
nstcpdump.sh -nn host 172.12.40.10 and port 4739
shellIf you do not see any traffic being received, your firewall is likely blocking it and need to investigate further.
tcpdump host 192.168.150.20 and port 4739 - Check to see what Cavium Nitrox chips (SSL accelerator cards) your physical NetScaler, such as an MPX NetScaler has (look for something like “CVM N3” in the output meaning Nitrox III processors):
sh hardwareIf you see something like “CVM 1620” those are the older generation Nitrox PX cards (N2 cards).If it’s an SDX appliance, you need to SSH into the XenServer, not the SVM. You must login with root, not nsroot. Then run:
lspci -vv | grep -i cavium - Sometimes when troubleshooting NetScaler MAS HDX Insight issues you will want to verify if flows are actually hitting NetScaler MAS and wether they are being processed or not. SSH into NetScaler MAS and type this to get to the logs directory:
cd /var/mps/logYou can then type this to list all the different NetScaler MAS logs available:
ls -ltrahThe one that logs AppFlow is called mps_afdecoder.log. I usually WinSCP this file off and run it through CMTrace but you can easily troubleshoot it within SSH as well for quick troubleshooting. Type:
tail -f mps_afdecoder.logand then try and launch an app. You will see the flow get processed and logged in real-time here. If you want to filter for Debug errors you can type:
tail -f mps_afdecoder.log | grep -vw DebugAnother technique is to tail the ns.log on the NetScaler itself for the user ID you are launching the app from to verify the app is truly getting launch from the right NetScaler (this is very helpful when using Optimal Gateway Routing and you are having issues with NetScaler MAS):
tail -f /var/log/ns.log | grep -i jasonsamuel - The tail command looks at the last part of a log file while the more command will view one page at a time and you press spacebar to go to the next page. The more command is nice when quickly needing to go through a large ns.log file with a lot of lines displayed to you even after filtering for a keyword. I also like to color the word I’m looking for so it is highlighted and stands out on the returned lines:
more -f /var/log/ns.log | grep -i jasonsamuel --color=auto - How to get an A security rating on securityheaders.com per my friend Jonathan Pitre. Note, you cannot get A+ at this time as it can break the Gateway login page:
12345678910111213141516171819202122232425262728293031323334enable ns feature rewriteadd rewrite action rw_act_insert_x-xss-protection insert_http_header X-XSS-Protection "\"1; mode=block\""add rewrite action rw_act_insert_x-content-type-options insert_http_header X-Content-Type-Options "\"nosniff\""add rewrite action rw_act_insert_x-frame-options insert_http_header X-Frame-Options "\"SAMEORIGIN\""add rewrite action rw_act_insert_referrer insert_http_header Referrer-Policy "\"SAME-ORIGIN\""add rewrite action rw_act_insert_expect_ct insert_http_header Expect-CT "\"enforce,max-age=30\""add rewrite action rw_act_insert_xdomain_policies insert_http_header X-Permitted-Cross-Domain-Policies "\"none\""add rewrite action rw_act_insert_CSP insert_http_header Content-Security-Policy "\"upgrade-insecure-requests; default-src \'self\'; script-src \'self\' \'unsafe-inline\' \'unsafe-eval\'; style-src \'self\' \'unsafe-inline\' \'unsafe-eval\'; img-src \'self\' data: http://localhost:*; child-src \'self\' com.citrix.agmacepa://* citrixng://*\""add rewrite action rw_act_insert_feature insert_http_header Feature-Policy "\"accelerometer 'none'; ambient-light-sensor 'none'; camera 'none'; encrypted-media 'none'; fullscreen 'none'; geolocation 'none'; gyroscope 'none'; notifications 'none'; magnetometer 'none'; microphone 'none'; midi 'none'; payment 'none'; push 'none'; speaker 'none'; sync-xhr 'self'; usb 'none'; vibrate 'none'; vr 'none'\""add rewrite action rw_act_remove_server delete_http_header Serveradd rewrite action rw_act_remove_x-powered-by delete_http_header X-Powered-Byadd rewrite policy rw_pol_insert_x-xss-protection "HTTP.RES.HEADER(\"X-XSS-Protection\").EXISTS.NOT" rw_act_insert_x-xss-protectionadd rewrite policy rw_pol_insert_x-content-type-options "HTTP.RES.HEADER(\"X-Content-Type-Options\").EXISTS.NOT" rw_act_insert_x-content-type-optionsadd rewrite policy rw_pol_insert_x-frame-options "HTTP.RES.HEADER(\"X-Frame-Options\").EXISTS.NOT" rw_act_insert_x-frame-optionsadd rewrite policy rw_pol_insert_referrer "HTTP.RES.HEADER(\"Referrer-Policy\").EXISTS.NOT" rw_act_insert_referreradd rewrite policy rw_pol_insert_expect_ct "HTTP.RES.HEADER(\"Expect-CT\").EXISTS.NOT" rw_act_insert_expect_ctadd rewrite policy rw_pol_insert_xdomain_policies true rw_act_insert_xdomain_policiesadd rewrite policy rw_pol_insert_CSP "HTTP.RES.HEADER(\"Content-Security-Policy\").EXISTS.NOT" rw_act_insert_CSPadd rewrite policy rw_pol_insert_feature "HTTP.RES.HEADER(\"Feature-Policy\").EXISTS.NOT" rw_act_insert_featureadd rewrite policy rw_pol_remove_server "HTTP.RES.HEADER(\"Server\").EXISTS" rw_act_remove_serveradd rewrite policy rw_pol_remove_x-powered-by "HTTP.RES.HEADER(\"X-Powered-By\").EXISTS" rw_act_remove_x-powered-byadd rewrite policylabel pol_lbl_security-headers http_resbind rewrite policylabel pol_lbl_security-headers rw_pol_insert_x-xss-protection 100 NEXTbind rewrite policylabel pol_lbl_security-headers rw_pol_insert_x-content-type-options 110 NEXTbind rewrite policylabel pol_lbl_security-headers rw_pol_insert_x-frame-options 120 NEXTbind rewrite policylabel pol_lbl_security-headers rw_pol_insert_referrer 130 NEXTbind rewrite policylabel pol_lbl_security-headers rw_pol_insert_expect_ct 140 NEXTbind rewrite policylabel pol_lbl_security-headers rw_pol_insert_xdomain_policies 150 NEXTbind rewrite policylabel pol_lbl_security-headers rw_pol_insert_CSP 160 NEXTbind rewrite policylabel pol_lbl_security-headers rw_pol_insert_feature 170 NEXTbind rewrite policylabel pol_lbl_security-headers rw_pol_remove_server 180 NEXTbind rewrite policylabel pol_lbl_security-headers rw_pol_remove_x-powered-by 190 NEXT
Quick packet capturing/tracing commands on the Citrix ADC (NetScaler)
Nstrace is a NetScaler script that will help you do a packet capture and is the gold standard for troubleshooting network traffic on a NetScaler. You can do it from the GUI or from a command line. If command line do not enter the “shell”. Always set packet size to 0 regardless of method chosen as this will capture each and every single packet regardless of what size the packet is. The “nstrace1.cap” or “nstrace1.pcap” files will be dropped into the “/var/nstrace” folder with a date and timestamp by default. Since much traffic these days is using SSL/TLS, capture the SSL keys using the “-capsslkeys ENABLED” switch which will save the keys to a separate file from the capture called “nstrace.sslkeys”. Or you can use the “sslplain” switch which will decrypt the trace on the fly so you don’t have to mess with keys at all.
- To begin capturing traffic:
start nstrace -size 0 -mode sslplain - To stop capturing traffic
stop nstrace - To show the status of the packet capture:
show nstrace - To create capture filters on a specific vserver you are troubleshooting:
start nstrace -size 0 -mode sslplain -filter "vsvrname == lbvsrv_StoreFront" - To capture all traffic to a destination IP:
start nstrace -size 0 -mode sslplain -filter "DESTIP == 192.168.1.10" - To capture all traffic hitting a source IP:
start nstrace -size 0 -mode sslplain -filter "SOURCEIP == 192.168.1.10" - To capture all traffic on a destination port:
start nstrace -size 0 -mode sslplain -filter "DESTPORT == 443" - To capture traffic from source IP on a specific port:
start nstrace -size 0 -mode sslplain -filter "SOURCEIP == 192.168.1.10 && DESTPORT == 443" - To do a cyclical nstrace capture to help troubleshoot intermittent issues and you don’t want to sit there all day babysitting a packet capture. Example, a new trace is captured every 60 seconds between the destination IP and source IP specified. It will create 50 of these files and then start overwriting them from oldest to newest. This will conserve drive space on the NetScaler while still allowing you to capture some traffic history. Just make sure to stop the nstrace as soon as the issue occurs so the files don’t get ovewrited:
start nstrace -size 0 -mode sslplain -filter "CONNECTION.DSTIP.EQ(192.168.1.10) || CONNECTION.SRCIP.EQ(10.0.0.10)" -size 0 -nf 50 -time 60 - Capture traffic on a specific network interface, example interface 0/1:
start nstrace -size 0 -mode sslplain -tcpdump ENABLED -filter CONNECTION.INTF.EQ("0/1") - Capture traffic on a specific VLAN, example VLAN 3:
start nstrace -size 0 -mode sslplain -tcpdump ENABLED -filter "CONNECTION.VLANID.EQ(3)"
Quick TCP dump commands on the Citrix ADC (NetScaler)
This is another NetScaler script. It is not as good as doing an nstrace but can grab quick TCP dumps for initial troubleshooting. It will output directly to the Putty/SSH window so no need to view traces in Wireshark. You must enter “shell” first before running these commands. Press Ctrl+C to stop the dump after it has started. The “>” sign denotes the direction of traffic (source to destination). You cannot run nstrace and nstcpdump at the same time.
For troubleshooting SSL ICA proxy, if you try and dump traffic to/from your NetScaler Gateway vserver IP (or Content Switching vserver IP if using Unified Gateway) and you have MAC based forwarding disabled (the default setting), then traffic will often be showing going back and forth to your default gateway IP. If you enable MAC based forwarding, then traffic will be shown between the NetScaler and the client IP. MAC based forwarding sometimes “hides” other fundamental networking issues in an environment so I don’t like using it.
For XenDesktop/XenApp troubleshooting, if you try and dump traffic on the VDA IP then you’ll see the 2 way communication between VDA and NetScaler SNIP. This is something I find very useful for troubleshooting purposes.
- To show all traffic going in or out of the NetScaler:
nstcpdump.sh - To show MAC addresses plus the IPs (good to find what network devices are talking to NetScaler):
nstcpdump.sh -ne - To show all traffic coming to or going out of a specific IP (both source or destination):
nstcpdump.sh host 192.168.1.10 - To show traffic sent to a destination IP:
nstcpdump.sh dst host 192.168.1.10 - To show traffic from a source IP:
nstcpdump.sh src host 192.168.1.10 - To show traffic conversation between 2 IPs (source and destination):
nstcpdump.sh host 192.168.1.10 and host 10.0.0.10 - To dump this output to a capture file:
nstcpdump.sh dst host 192.168.1.10 -w /tmp/tcpdump_output.cap - To show the first 30 packets only and then stop:
nstcpdump.sh -c 30 dst host 192.168.1.10 - To show all traffic on a specific port:
nstcpdump.sh port 443 - To show all traffic to a destination IP on a specific port:
nstcpdump.sh dst host 192.168.1.10 and port 443 - To show all traffic from a source IP on a specific port:
nstcpdump.sh src host 192.168.1.10 and port 443 - To show all ICMP ping requests to a destination host (the ping-default monitor is a very common monitor used):
nstcpdump.sh icmp and dst host 192.168.1.10
Quick ways to parse events on the Citrix ADC (NetScaler)
Nsconmsg is an executable that will show you console messages on the NetScaler. You must be in “shell”. If you use it against the newslog you can grab historical events. DO NOT USE lowercase “k” as it is used in conjunction with another switch to overwrite what you are looking at. Only use uppercase “K” for reading.
• Ns.log is the system syslog file. It and related historical logs (ns.log.xx.gz) are in /var/log.
• Newns.log is the main log file. It and related historical logs (newnslog.xx.gz) are in /var/nslog. There will also be an ns.log here.
• Auth.log is the authentication and authorization log (AAA log) and is located in /var/log. This is different from the aaad.debug log you usually dump into /tmp.
If you ever grab the newslog .gz files and decompress them onto a Windows box they will have the extension newnslog.ppe.0, newnslog.ppe.1, etc. These are created by the packet engine (nsppe process). Use nsconmsg on the NetScaler to view these files.
- One of my favorites is to tail the ns.log so I can catch realtime events (tail shows the tail end of the log). It also shows GUI commands so it’s a great way to see what command line is executed on the NetScaler with each click:
tail -f /var/log/ns.log - You can also cat the ns.log to look at historical events:
cat /var/log/ns.log - Will show you what major events happened historically to vservers (up, down, probe/monitor failures, etc):
nsconmsg -K /var/nslog/newnslog -d event - You can look at older logs by doing. This will decompress the gz file and parse through the log for you:
nsconmsg -K /var/nslog/newnslog.24.tar.gz -d event - And further commands can be run directly against the decompressed newnslog like this:
nsconmsg -K /var/nslog/newnslog.24 -d event - Watch policy hits in realtime:
nsconmsg -d current -g pol_hitsNOTE: If you notice you’re not seeing all policy hits, you may be running a 12.0 or higher firmware. In 12.0 or higher firmware this command only shows classic policy hits. If you want to see session and advanced policy hits (like those used for advanced authentication policies) you need to use the following command as well. Note that pcb_hits is not a replacement for pol_hits, you need to use both to get a full picture of what all is being hit. You can have 2 Putty SSH windows open (use the Duplicate Session option) and run both commands side by side if you like:
nsconmsg -d current -g pcb_hitsAlternatively you can look for just the word “hits” which will give both plus a bunch more data to look at. It may be hard to find what you’re looking for on NetScalers with a lot of traffic when doing this:
nsconmsg -d current -g hits - Watch for SAML authentication issues (normal login will show saml_assertion_verify_success, saml_tot_dht_put_success, saml_tot_dht_get_notfound):
nsconmsg -d current -g saml - Look at historical SAML authentication:
nsconmsg -d stats -g saml - To look for IP conflicts (everything will be green and seem like it’s working on the appliance so the log is the only way to tell of IP conflicts from other systems on the network):
nsconmsg -K newnslog -d | grep conflictAnd you will get entries like this which prove an IP conflict:
IP address conflict 192.168.101.106! sent from ethernet address: 00:0a:49:c6:f6:40Take the conflicting MAC address above and go to the Coffer website at http://www.coffer.com/mac_find/ to verify which device the MAC belongs. In this example the MAC addresses that starts with prefix 00:0A:49 belongs to an F5 appliance. This means the F5 appliance has the same IP on it as one of the NetScaler vservers has as a virtual IP in most cases from my past experience troubleshooting these types of issues.
Quick Wireshark display filters to troubleshoot Citrix ADC (NetScaler)
Note, these are display filters to use after you have captured a trace. These are not capture filters that you use while actively capturing traffic.
- To show all traffic to or from a source IP or destination IP:
ip.addr == 192.168.1.10 - To show all conversation traffic between 2 IP addresses (source IP and destination IP):
ip.addr==192.168.1.10 && ip.addr==10.0.0.10 - To show all http and dns traffic only (filtering by protocol):
http or dns - To hide all the ARP, ICMP, DNS noise that is common in packet captures:
!(arp or icmp or dns) - To filter traffic by port:
tcp.port==443 - To display TCP resets:
tcp.flags.reset==1 - To display all HTTP GET requests:
http.request - To display all HTTP GET requests and the responses:
http.request or http.response - To display all TCP packets that contain a certain word in the payload. In this example the User ID “jdoe”:
tcp contains jdoe - To display TCP retransmissions (good indicator of packet loss or slow performance):
tcp.analysis.retransmission - To display a specific User Agent, example “CitrixReceiver”:
http.user_agent contains "CitrixReceiver"
Splunk syslog search filters for Citrix ADC (NetScaler)
- Find successful NetScaler Gateway logins with device/browser, user ID, and IP address:
source="YourNetScalerSource" index="YourNetScalerIndex" SSLVPN LOGIN NOT (HTTPREQUEST)
OR
source="YourNetScalerSource" index="YourNetScalerIndex" Authentication succeeded - Find failed NetScaler Gateway logins with device/browser, user ID, and IP address:
source="YourNetScalerSource" index="YourNetScalerIndex" AAA LOGIN_FAILED - Create a report of Top 20 SSL ciphers being used on a NetScaler Gateway vserver:
source="YourNetScalerSource" index="YourNetScalerIndex" CipherSuite VserverServiceIP xxx.xxx.xxx.xxx| top limit=20 SSLCipher
where SSLCipher is the following custom field extraction:
1^(?:[^\-\n]*\-){10}\s+(?P<SSLCipher>.+)
OR
source="YourNetScalerSource" index="YourNetScalerIndex" CipherSuite VserverServiceIP xxx.xxx.xxx.xxx| top limit=20 SSLClientVersion SSLCipher
where SSLClientVersion and SSLCipher are the following custom field extraction:
1^(?:[^\-\n]*\-){7}\s+(?P<SSLClientVersion>\w+\s+\w+\.\d+)\s+\-\s+(?P<SSLCipher>\w+\s+"\w+\-\d+\-\w+\-\w+\s+\w+\d+\.\d+\s+\w+\-\w+\s+\d+\-\w+") - Find NetScaler Gateway ICA launches with the name of the app/desktop, user ID, and IP address:
source="YourNetScalerSource" index="YourNetScalerIndex" SSLVPN ICASTART
Atlantis ILIO/USX commands
These Linux commands are useful but depend on your storage setup and if you are using ILIO Diskless or ILIO Persistent. These are commands that I personally use so modify as needed.
- ILIO appliance snapclone info assuming disk 1 is snapclone:
dstat -D sdb -cdln --disk-util - ILIO appliance snapclone partition info:
dstat -D sdb2 -dsr --disk-util - ILIO VM total disk usage:
df -h /exports/ILIO_VirtualDesktops - ILIO appliance VM info (network, disk, resource with resource limit on nfs stack on dom0):
dstat -D dm-0 -ndr --nfsd3 - ILIO appliance VM info (time, load, network, cpu, disk, resource):
dstat -D dm-0 -tlncdr --nfsd3 - ILIO appliance OS info assuming it is disk 0 (network, disk, resource on disk):
dstat -D sda -ndr --disk-util - ILIO appliance VM snapclone info assuming it is disk 1 (network, disk, resource on disk):
dstat -D sdb -ndr --disk-util
PowerShell Oneliners
Just open a PowerShell window and drop each line in to get a result.
This first set of one liners returns common redirected folders. If you use AppSense for example, you will likely be redirecting these folders to a file share for each user. You can use these one liners as a base for advanced scripts on reporting redirected user folders for all your users:
- Display the redirected Desktop folder:
[Environment]::GetFolderPath("Desktop") - Display the redirected My Documents folder:
[Environment]::GetFolderPath("MyDocuments") - Display the redirected My Music folder:
[Environment]::GetFolderPath("MyMusic") - Display the redirected My Pictures folder:
[Environment]::GetFolderPath("MyPictures") - Display the redirected My Videos folder:
[Environment]::GetFolderPath("MyVideos")
Time-Saving Scripts
- Script that will auto-create folders based on file name of all files in a directory and then move those files into their respective folders. Name the script organize.bat, put it in the root with your files, run it for instant file organization. Courtesy of Boon Seong: https://almost-a-technocrat.blogspot.com/2018/04/auto-create-folder-based-on-filename.html
123456@echo offfor %%i in (*) do (if not "%%~ni" == "organize" (md "%%~ni" && move "%%~i" "%%~ni"))
AutoHotkey Scripts
- Left click mouse every 2 seconds in a loop. Good foundation to do more advanced stuff with.
12345678Loop{clicksleep 2000clicksleep 2000}return
Citrix Content Collaboration (ShareFile) Scripts
- Enumerate every user email, user display name, userID, and company name in a ShareFile (Citrix Content Collaboration) tenant and output to a .txt file. You can then massage the data and turn it into a .csv file to run further actions on it.
12345678910111213141516#Add the ShareFile PowerShell snap-in you installed from https://support.citrix.com/article/CTX207460 and authenticate in a new window that pops up with your ShareFile Admin credentialsAdd-PSSnapIn ShareFile$sfClient = New-SfClient#Pull all of the Account Employees or Clients$sfUsers = Send-SfRequest -Client $sfClient -Entity Accounts\Employees$fileOutput = @()#Loop through each of the usersforeach($sfUserId in $sfUsers) {#Get full user information including security$sfUser = Send-SfRequest -Client $sfClient -Entity Users -Id $sfUserId.Id$fileOutput += New-Object PSObject -Property @{'UserId'=$sfUserId.Id;'FullName'=$sfUser.FullName;'Email'=$sfUser.Email;'Company'=$sfUser.Company}}#output the results to a .txt file$fileOutput | Out-File -FilePath C:\temp\sharefile-users.txt
If you have a web proxy and PowerShell won’t open the authentication web view window to login to ShareFile, you can add this to the top of your script to use the same proxy as your web browser and force it to open the window:
12$browser = New-Object System.Net.WebClient$browser.Proxy.Credentials =[System.Net.CredentialCache]::DefaultNetworkCredentials - Script to delete users from a .txt file with their ShareFile GUIDs
123456789101112131415161718#Script to delete users from a .txt file with their ShareFile GUIDs only listed in a file at C:\Temp\sharefile_users_to_delete.txt#This will pop up with a login box for your ShareFile admin level credentials and then store them in an .sfps access token file to be used with the loopFunction DeleteUsers{Param ([string]$UserType="employee")$sfclient = Get-SfClient -Name "c:\Temp\yourcompany.sfps"$sfUserObjects = Get-Content "C:\Temp\sharefile_users_to_delete.txt"$sfUserObjectsforeach($sfUser in $sfUserObjects){Send-SfRequest -Client $sfclient -Method DELETE -Entity Users -Id $sfUser -Parameters @{"completely" = "true"}}}Add-PSSnapin ShareFileNew-SfClient -Name "c:\Temp\yourcompany.sfps"DeleteUsers -UserType "employee"; - Quick 3 liner to pull details on a certain user by their ShareFile GUID:
123Add-PSSnapIn ShareFile$sfClient = New-SfClientSend-SFRequest –Client $sfClient –Method GET –Entity Users -Id "02e57187-2b0b-481a-be51-428bd454f546" - Quick 3 liner to DELETE a certain user by their ShareFile GUID:
123Add-PSSnapIn ShareFile$sfClient = New-SfClientSend-SFRequest –Client $sfClient –Method DELETE –Entity Users -Id "02e57187-2b0b-481a-be51-428bd454f546" -Parameters @{"completely" = "true"}
Proxy analysis commands
- How to get PAC (Proxy Auto-Config) and WPAD (Web Proxy Auto-Discovery Protocol) proxy information delivered via DHCP or DNS from IE or Chrome in explicit proxy configurations:
IE - http://wpad/wpad.dat and then open the .dat file in NotepadChrome - chrome://net-internals/#proxy and click through it